Figure 1.

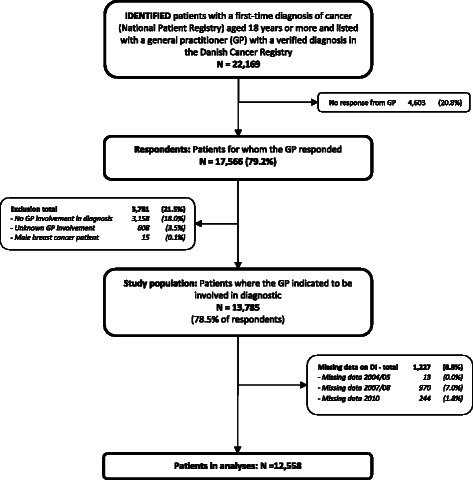
Flowchart for cancer patients. Boxes on the left indicate exclusion of patients who did not meet the inclusion criteria and boxes on the right indicate drop-outs due to non-response and missing data.

Flowchart for cancer patients. Boxes on the left indicate exclusion of patients who did not meet the inclusion criteria and boxes on the right indicate drop-outs due to non-response and missing data.