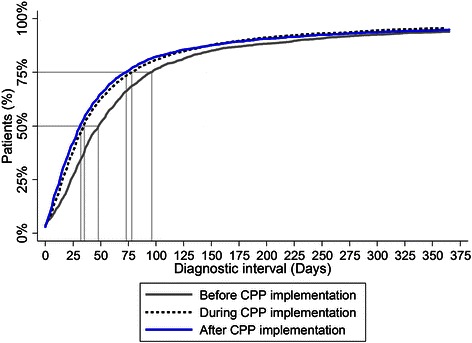
Figure 2.

Cumulative frequencies of diagnostic interval (DI) before, during and after CPP implementation in Denmark. DI ranked in order and depicted by a Lorenz diagram. DI of longer than 365 days omitted for illustration purposes.

Cumulative frequencies of diagnostic interval (DI) before, during and after CPP implementation in Denmark. DI ranked in order and depicted by a Lorenz diagram. DI of longer than 365 days omitted for illustration purposes.