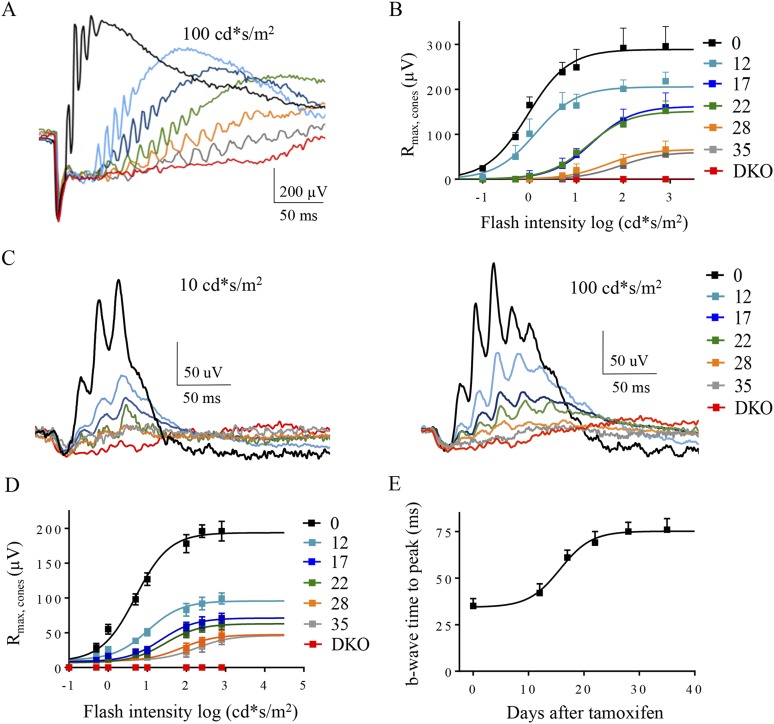
Figure 7. The effect of progressive RGS loss on cone ON-BC responses as revealed by photopic ERG.
(A) Representative dark-adapted ERG responses elicited with photopic (100 cd*s/m2) flashes from cDKO:Cre+ mice at 0, 12, 17, 22, 28, and 35 days post-tamoxifen administration. (B) Cone-generated component of the ERG response extracted from fitting the second phase of the response in Figure 5B. (C) Representative light-adapted ERG responses elicited with photopic flashes (10 cd*s/m2, left) and (100 cd*s/m2, right). Steady background light of 50 cd/m2 was applied to saturate rods. (D) ON-BC dose-response plot of maximal ERG b-wave amplitudes recorded with background light and plotted against their eliciting flash intensities. (E) Analysis of the changes in the ERG b-wave onset timing elicited by half-saturating flash intensities on a light background. Errors bars are SEM. Figure 2—figure supplement 1: isolation of the ERG b-wave peak.


