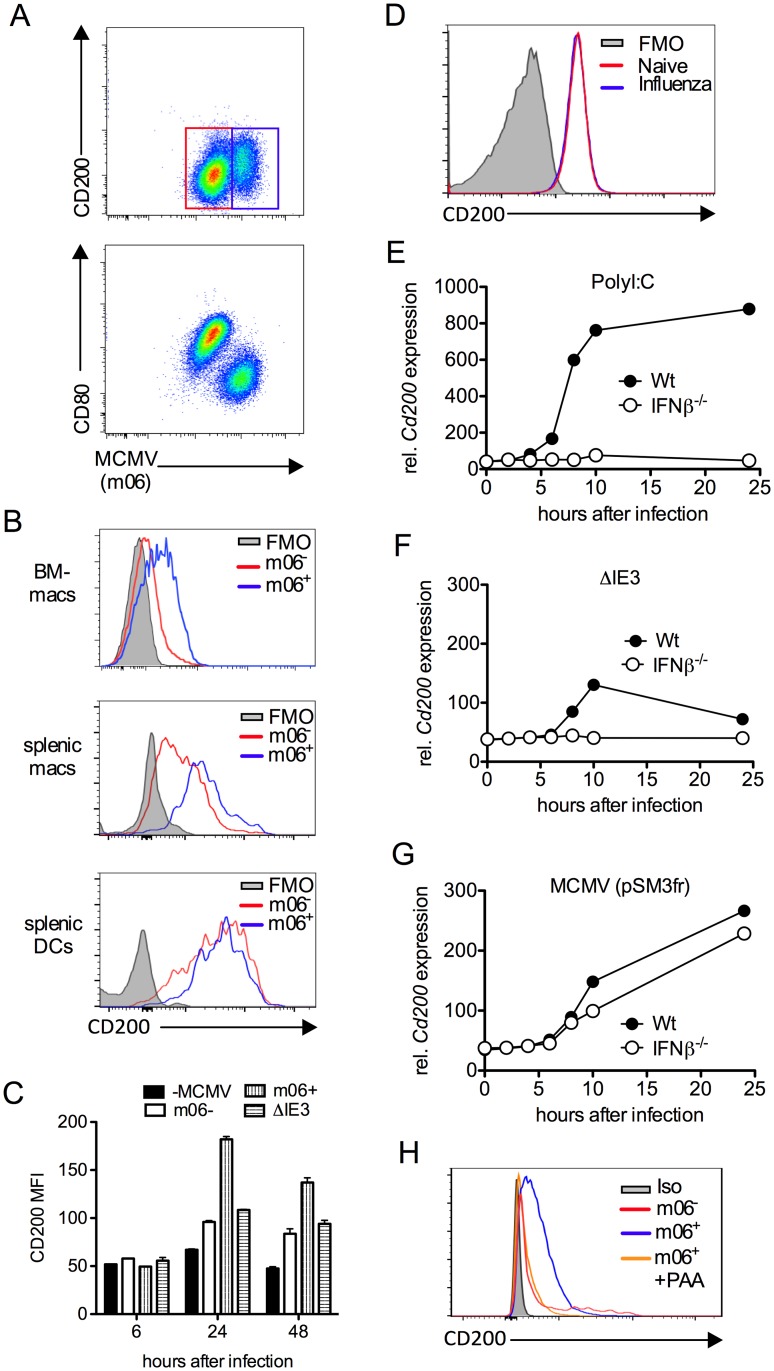
Figure 3. MCMV induces CD200 expression by macrophages.
(A-C) Bone marrow-derived macrophages (BM-DMs) were infected with pSM3fr MCMV and CD200 expression was assessed. (A) Representative bivariant flow cytometry plots of MCMV infection (m06+) versus CD200 (top) and CD80 (bottom) 24 hrs pi. (B) Representative histograms of CD200 expression by infected (m06+, blue) and uninfected/virus exposed cells from the same well (m06-, red). BM-DMs (top), splenic F4/80+ macrophages (middle) and splenic CD11chi MHC IIhi DCs (bottom). FMOs are cells from infected cell cultures (containing infected and uninfected cells). (C) CD200 expression by MCMV-infected (m06+), MCMV-exposed (m06-) and ΔIE3 MCMV-infected BM-DMs was compared to expression by mock-infected cells. Data are expressed as median fluorescence intensity (MFI) and are expressed as mean + SEM of 2 replicates. Results represent 2–5 experiments. (D) BM-DMs were infected or not with influenza strain PR8 (MOI:1), and CD200 expression was assessed 24hrs later by flow cytometry. FMOs are from uninfected macrophages. Data from 1 of 2 experiments is shown. (E-G) BM-DMs were treated with (E) PolyI:C or infected with (F) replication deficient ΔIE3 MCMV or (G) wt MCMV (pSM3fr) and cd200 expression assessed by microarray. (H) BM-DMs were infected with wt MCMV +/- PAA, and CD200 expression was assessed 24hrs later. Data is shown as a representative histogram (of 2 separate experiments) depicting CD200 expression by uninfected/virus exposed cells (m06-, red), infected cells (m06+, blue) and PAA-treated m06+ cells (orange). Grey = m06+ untreated cells stained with isotype control (rat IgG2a-PE).

