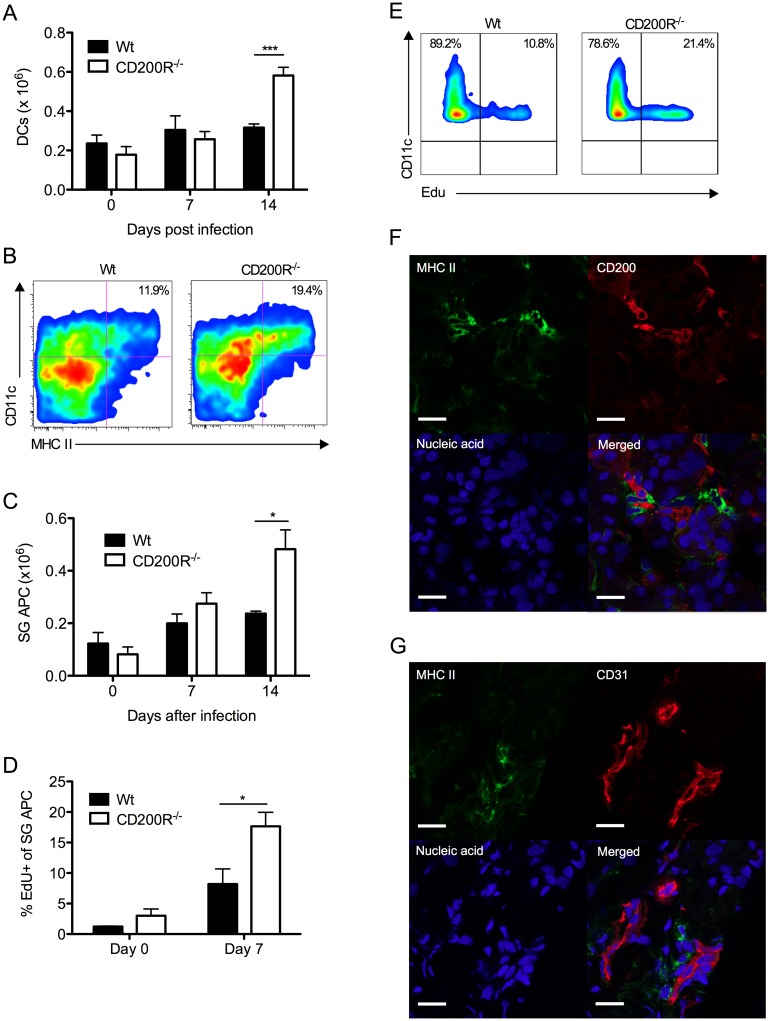
Figure 5. CD200R restricts myeloid cell accumulation and SG-APC proliferation.
(A) Time-course of accumulation of splenic CD11c+MHC II+ cells in wt and CD200R-/- mice. Mean + SEM of 4–11 mice/group is shown. (B) Representative flow cytometry plots of CD11c+MHC II+ SG-APCs in wt (left) and CD200R-/- (right) at day 7 pi. (C) Numbers of SG-APCs over time. Mean + SEM of 6 mice/group is shown. (D) Proliferating (EDU+) SG-APCs were assessed by flow cytometry. Mean + SEM of 3–6 mice/group is shown. (E) Representative bivariant flow cytometry plots of EDU incorporation by SG-APCs in wt (left) or CD200R-/- (right) mice at day 7 pi. Data is gated on live CD11c+MHC II+ cells. All results represent at least 2 independent experiments. (F&G) Wt mice were infected with MCMV and SGs harvested 7 days pi. (F) MHC II (green) expressing cells adjacent to large CD200+ (red) endothelial cells. (G) MHC II (green) expressing cells adjacent to CD31+ (red) endothelial cells. Sections were counterstained with TOTO-3 (blue) to detect DNA. Magnification = 63x, white scale bars = 20μm.

