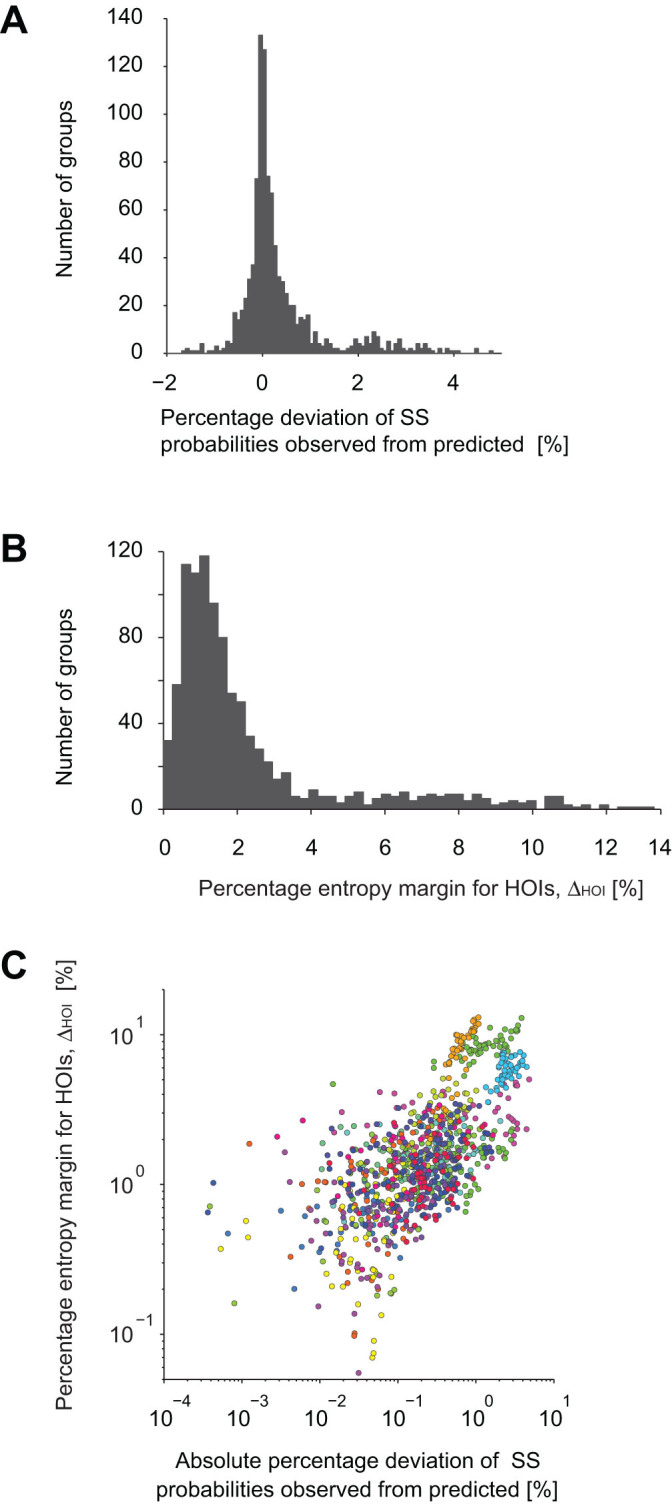
Figure 2. Sub-groups of 10 hippocampal neurons exhibit longer periods of SS than predicted from pairwise interactions.

(A) Distribution of the percentage deviation of the observed probability of
SS of 10 neurons from the prediction of the pairwise model,  . Positive values indicate more
frequent SS in the data than predicted by the pairwise model. (B) Histogram
of percentage entropy margins for HOIs computed as
  . (C) Dependency of the percentage
entropy margin for HOIs on the percentage deviation of the observed from
predicted probabilities of SS. The same color indicates groups selected from
the same slice culture. 5 outliers were excluded from the plots.
