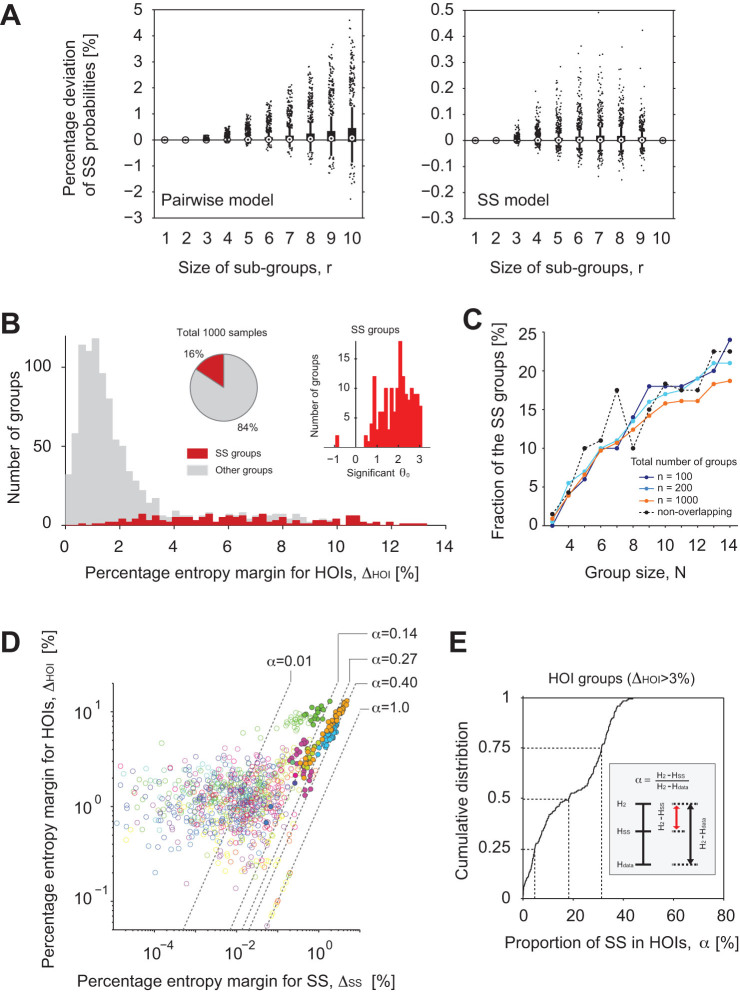
Figure 3. Significant SS is observed in the groups of 10 neurons exhibiting HOIs.
(A) (Left) Comparison of the observed SS probabilities of sub-groups of  neurons with predictions of the
pairwise model. Abscissa, the size
  of sub-groups. Ordinate, the percentage deviation of observed
from predicted average SS probabilities of sub-groups of neurons, where the
normalization divides the difference by SS probability predicted from a
pairwise model. The comparison was performed for all possible sub-groups of
 neurons in the 1000 groups
of 10 neurons. Whiskers represent 1.5 times the distance from
25th to 75th percentile. Dots are outliers. (Right) Comparison of the
observed SS probabilities of the sub-groups with predictions of the SS
model. Note the difference in the scales of the ordinates in the Left and
Right panels. (B) Distribution of percentage entropy margins for HOIs for
the SS groups (red, 16%), i.e. groups for which the SS model showed
significantly better fit than the pairwise model, and the rest of the groups
(gray, 84%). The right inset shows distribution of the parameter
  of the SS groups. The
distribution was heavily biased toward positive
  , indicating prevalent excess SS. (C) Group
size dependency of the number of SS groups. Solid lines with different
colors indicate different numbers of groups selected from each slice: 5, 10,
50 groups per slice, for a total of
  100, 200, and 1000 groups of size
  from 20 slices, respectively. The dashed black
line is the result of selecting non-overlapping groups from each slice (see
Methods). Thus, the fraction of SS groups and its group size dependency were
robust to the degree of overlap between sampled groups in each slice. (D)
Scatter plots of entropy margins for HOIs versus entropy margins for SS. The
same color indicates groups selected from the same slice culture. Filled
circles indicate SS groups. Dashed lines represent different proportions of
HOI entropy margin explained by the SS term,
  . We excluded 13 outliers from the plots. (E)
Cumulative distribution function of the proportion of SS,
  , in the groups exhibiting HOIs (
 > 3%).

