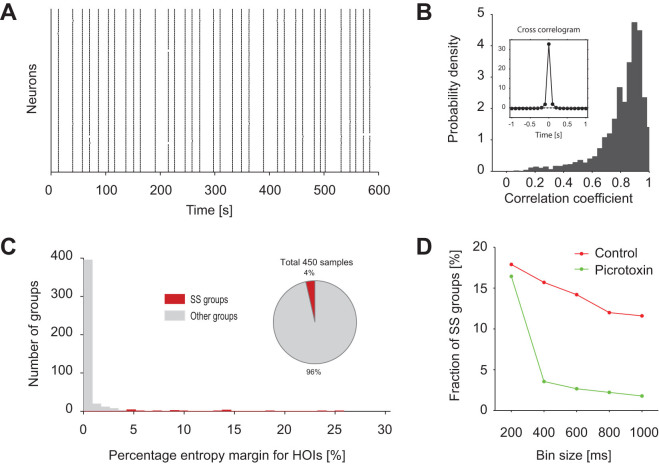
Figure 5. Blocking inhibitory networks by PTX eliminated HOIs.
The panels retain the same presentation format as in Fig. 1A, D and Fig. 3B. (A) Ensemble activity of 76 neurons in the CA3 area of a single hippocampal slice under bath application of PTX. (B) Distribution of correlation coefficients between two event sequences (resolution of 100 ms) of all the pairs of neurons in 450 groups from 9 slices. Inset shows an average cross-correlogram. (C) Distribution of percentage entropy margin for HOIs. The groups that showed improved fitting with the SS term are marked in red (the SS groups, 4%). Others (96%) are in gray. (D) The number of the SS groups with respect to the bin size for the analysis.

