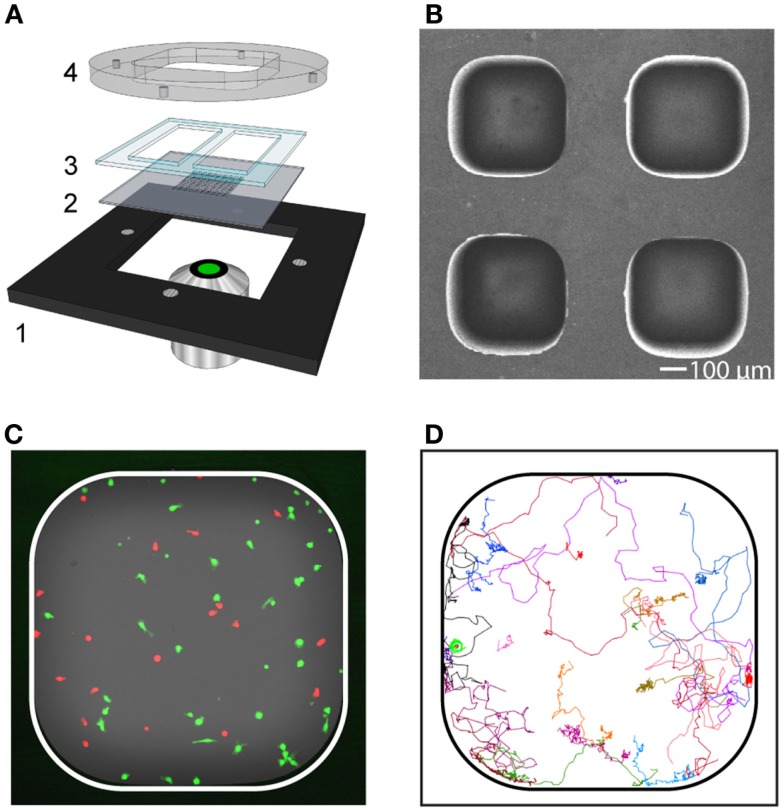
Figure 2.
Long-term live-cell imaging in microwells for characterization of migration and contact dynamics. (A) Schematic picture of the device consisting of a metal holder (1), multi-well silicon-glass microchip (2), PDMS gasket (3), and lid (4). The lid was held tightly against the metal holder by magnets. The PDMS gasket was cut to create two separate basins (one per condition), each containing approximately 30 microwells. (B) Scanning electron microscopy image showing a subsection of the microchip. The dimension of the microwell bottom was 450 × 450 μm2 and the well depth was 300 μm. (C) Fluorescence image of a microwell containing T cells (red) and target cells (green). (D) Trajectories from T cells (n = 23) followed in a representative time-lapse sequence.

