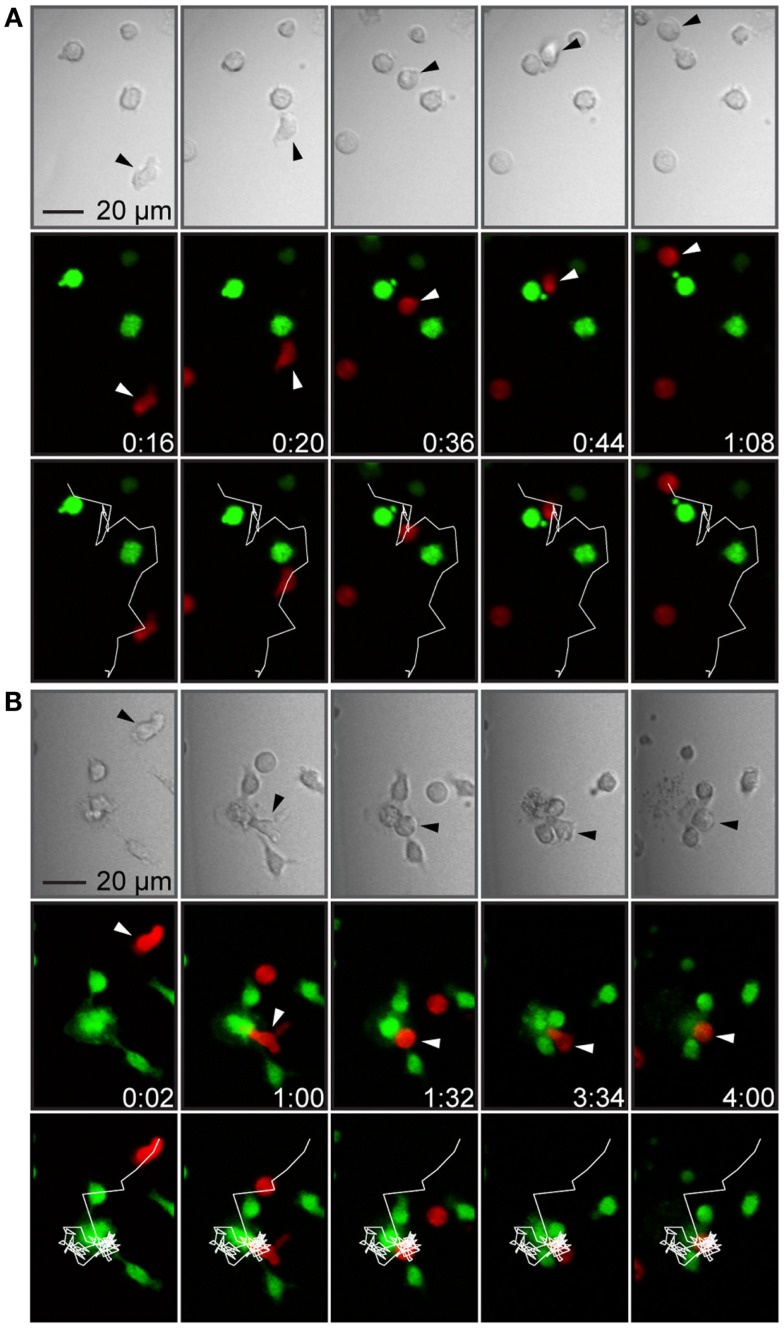
Figure 4.
T cell–target cell interactions were brief or more stable, sometimes leading to target cell death. (A) Time-lapse sequence showing a T cell forming a brief contact with a target cell. The panels show transmitted light (top), fluorescence showing T cells in red and target cells in green (middle) and fluorescence overlaid with the T cell trajectory (white line, bottom). A T cell (marked by arrowheads) migrated toward a target cell (frame 1), formed a contact with the target cell (frame 2), continued migrating while attached to the target cells, scanning the target cell surface (frames 3 and 4), and finally detached without forming a stable conjugate or killing the target cell (frame 5). (B) Time-lapse sequence showing T cell-mediated target cell death. Panels as in (A). A T cell (marked by arrowheads) migrated with an elongated shape (frame 1), made a contact with a target cell within a cluster of three cells (frame 2), rounded up, and formed a conjugate (frame 3), which was followed by target cell death seen as a decreased green fluorescence intensity and a cloud of cellular debris in the transmitted light channel (frames 4 and 5). Indicated times are hours:minutes and scale bar represent 20 μm. Images have been resampled and brightness and contrast altered to improve visibility.

