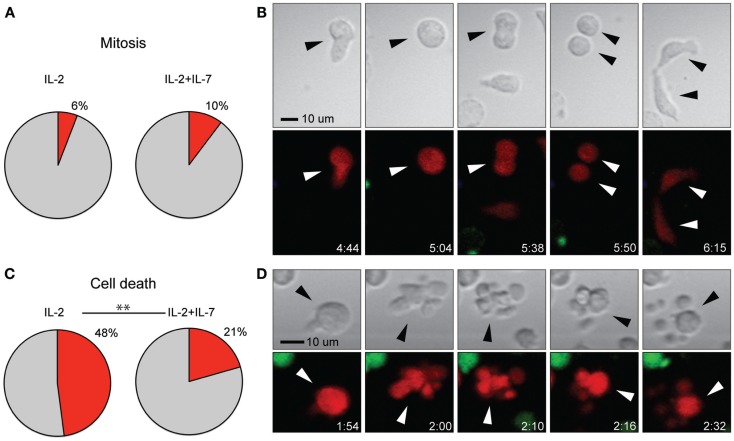
Figure 5.
Addition of IL-7 had no effect on rate of T cell mitosis but decreased cell death. (A) Percentage of T cells undergoing mitosis during the 7-h assay for the two conditions. (B) Time-lapse imaging data of cell division shown in transmission (top) and fluorescence (bottom). A T cell (red fluorescence) migrated with a typically elongated, migratory shape (frame 1) and stopped, enlarged, and rounded up (frame 2), this interphase was followed by mitosis where the cells split into two daughter cells (frames 3 and 4) and finally cytokinesis (frame 5), where the new cells were divided. Indicated times are hours:minutes and the scale bar represents 10 μm. (C) Percentage of T cells dying during the 7-h assay for the two conditions (p < 0.005). (D) Time-lapse imaging data of T cell death shown in transmission (top), fluorescence (bottom). A migrating T cell (red fluorescence) stopped and rounded up (frame 1), followed by cell death seen as membrane blebbing in the transmitted light image (top) and decreased red fluorescence intensity (bottom) (frames 2–5). Indicated times are hours:minutes and scale bar represents 10 μm. Chi-squared test was used to compare the rate of cell death and mitosis between the two culture conditions. The data in (A,C) are based on three individual experiments (IL-2 n = 219, IL-2 + IL-7 n = 175). Images have been resampled and brightness and contrast altered to improve visibility.

