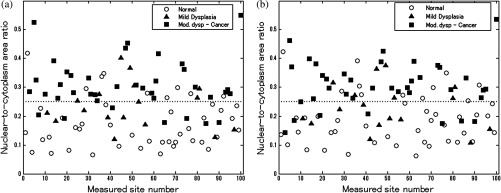
Fig. 5.

Scatter plots of N/C ratio for each site in the oral data set: (a) scatter plot of N/C ratio for manually selected frames; (b) scatter plot of N/C ratio for automatically selected frames. The threshold line used for classification is shown as a horizontal line in each scatter plot. The optimal threshold was set at the Q-point of the ROC curve ( for manually selected frames; for automatically selected frames).
