
Figure 2.
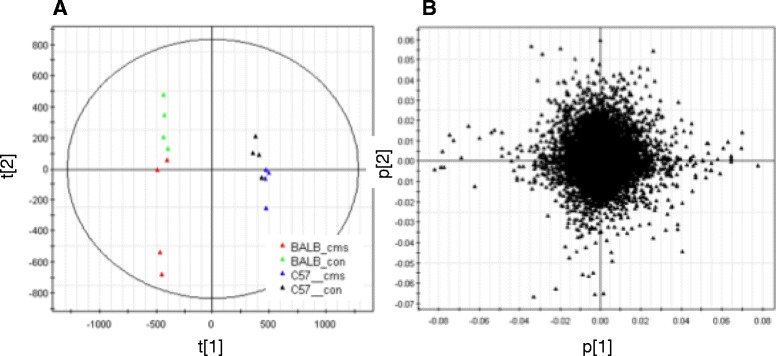
Scores and loading plots. PCA scores and loadings plots for the first two components of a model fitted to the mouse transcript data set. Figure A shows scores plot with the observations color coded according the legend. Figure B shows the loadings plot of variables.