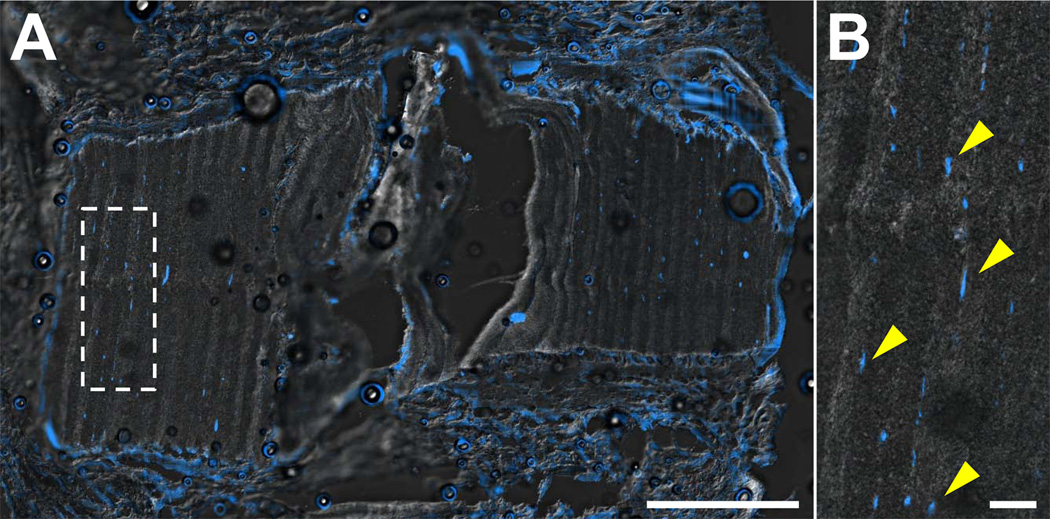
Figure 6. Cell infiltration into PCL-only DAPS in vivo.
Representative DAPI staining of cell nuclei from a fixation+DAPS implant on day 28 at low magnification (A) and high magnification (inset) (B) overlaid with a DIC image of the DAPS structure. Cells aggregated at the periphery of the DAPS, with little infiltration into the DAPS layers. Cells that did populate the interlamellar space (arrows) had elongated nuclei, indicative of their orientation with the nanofiber template. Scale = 1mm in panel (A) and 100 µm in panel (B).

