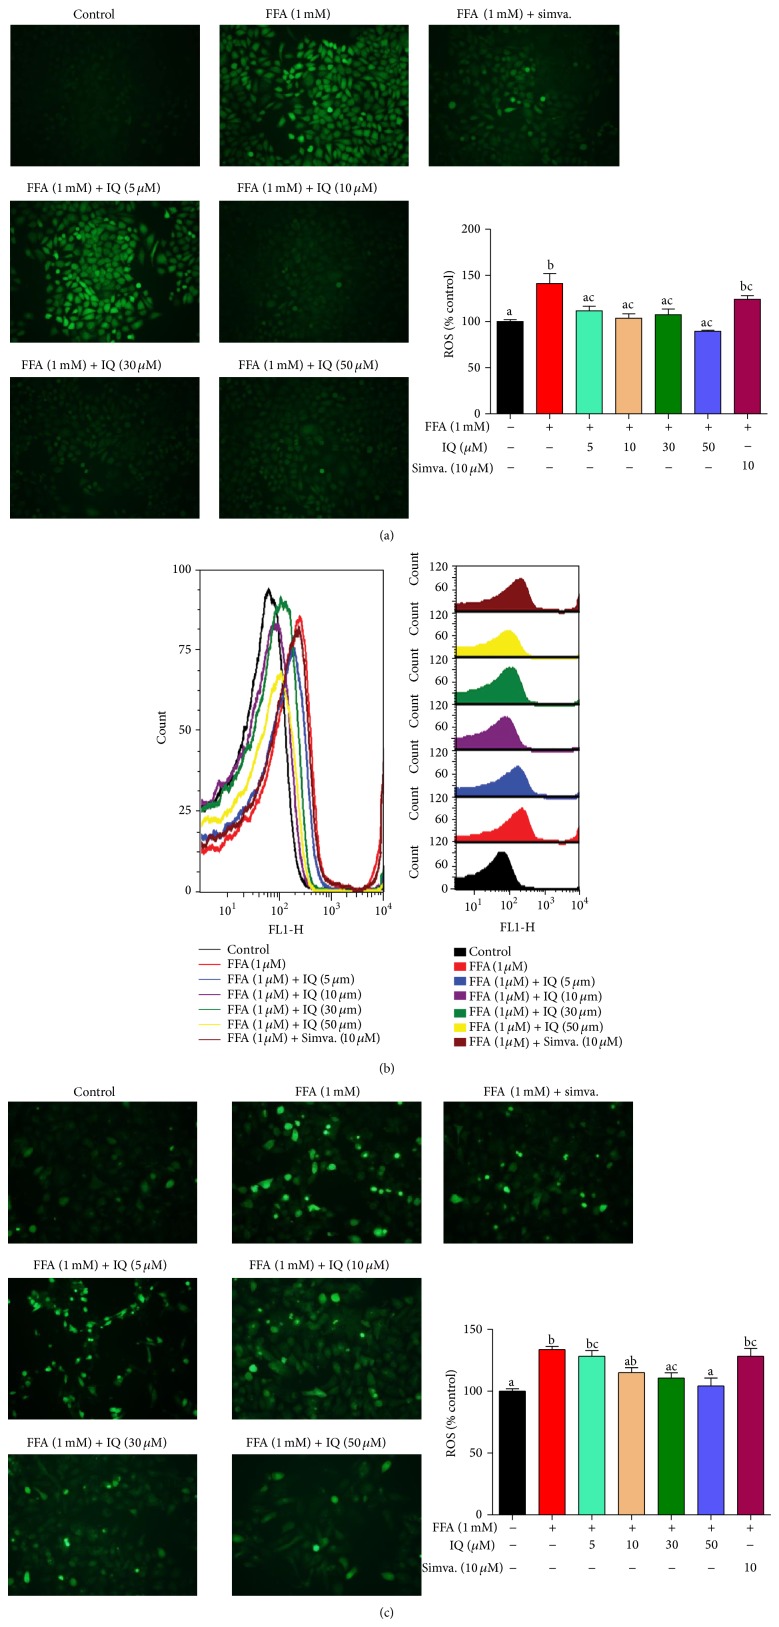
Figure 4.
Effects of IQ on ROS in FFA induced primary rat hepatocytes and BRL-3A cells. (a) shows the pictographs of effects of IQ on BRL-3A cells. Magnification ×200. (b) illustrates the histograms from flow cytometry showing effects of IQ on primary rat hepatocytes. (c) demonstrates the pictographs of primary rat hepatocytes exhibiting effects of IQ. Magnification ×200. The data represents ±SD. P < 0.05 was considered as statistically significant. Different superscripts letters demonstrate the significant statistical difference as calculated by ANOVA followed by Tukey's test.

