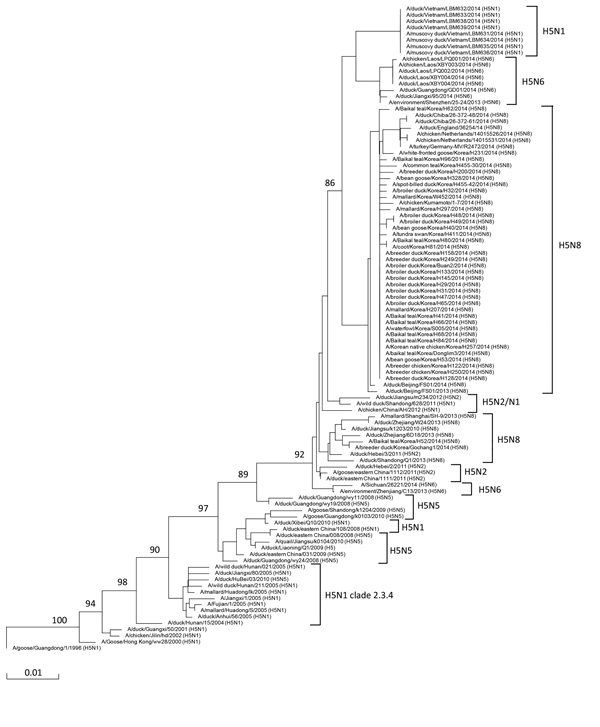
Figure 2.

Hemagglutinin protein tree (neighbor-joining, point accepted mutation distance matrix model) of subtypes present in branch descending from highly pathogenic avian influenza A(H5N1) cluster 2.3.4 (see Figure 1). MUSCLE (9) was used to align protein sequences. Subtype group positions are indicated at right. Bootstrap values (n = 1,000) at key nodes are indicated. Scale bar indicates evolutionary distance (nucleotide substitutions per site).
