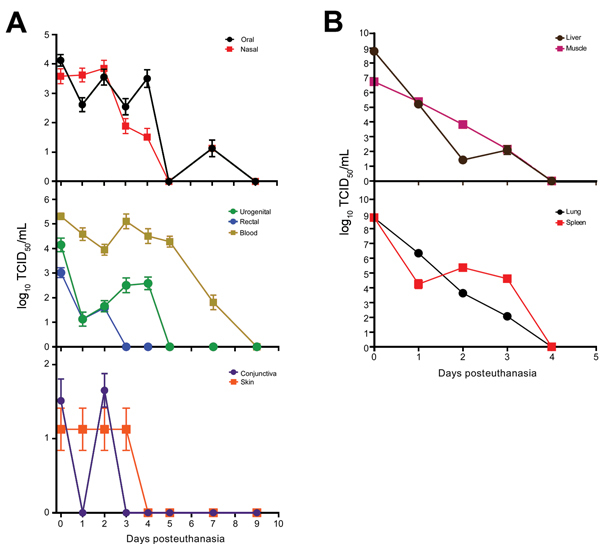
Figure 2.

Efficiency of Ebola virus isolation from deceased cynomolgus macaques. Swab (A) and tissue (B) specimen samples were obtained at the indicated time points, and virus isolation was attempted on Vero E6 cells. Cells were inoculated in triplicate with serial dilutions of inoculum from swab specimens placed in 1 mL of medium or tissues homogenized in 1 mL of medium. The 50% tissue culture infectious dose (TCID50) was calculated by using the Spearman-Karber method (8). Line plots show means of positive samples from 5 animals to the day 9 time point. Error bars indicate SD.
