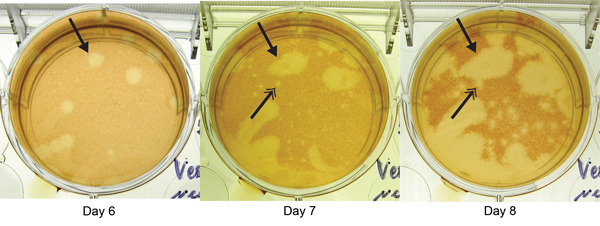
Figure 1.

Plaque reduction neutralization test of patient sample for Heartland virus, showing images of the same well obtained days 6, 7, and 8 postinoculation at a dilution of 1:20. Arrows with single heads indicate appearance of a novel virus plaque beginning at day 6. Arrows with double heads indicate development of a typical Heartland virus plaque, apparent on day 7 and more evident on day 8, generated from a control strain added to each well in defined quantities to identify Heartland virus–specific antibodies in the patient sample.
