
Figure 2.
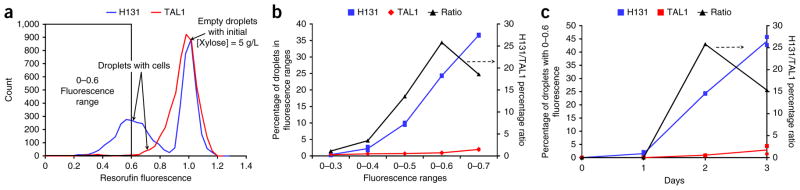
Development of screen for high xylose–consuming strains. (a) Fluorescence intensity distributions of two populations of droplets: one containing high (H131) and the other low (TAL1) xylose-consuming yeast strains, after 2 d of culturing. High fluorescence characterizes droplets with no cells, and low fluorescence, droplets with cells. A larger fraction of droplets with low xylose concentrations is observed for strain H131, as expected. (b) Effect of fluorescence range on the fraction of H131- and TAL1-containing droplets after 2 d of culturing. (c) Effect of culturing time on the fraction of H131- and TAL1-containing droplets using data from the 0–0.6 fluorescence range. A statistical model using all time points showed that H131 had a statistically higher xylose consumption than TAL1 (P < 0.0001 using an F-test). In b and c, the data points are the percentage of droplets of each strain in a fluorescence bin range. The lines represent the average of the data points from the biological replicate experiments (n = 2).