Fig. 3.

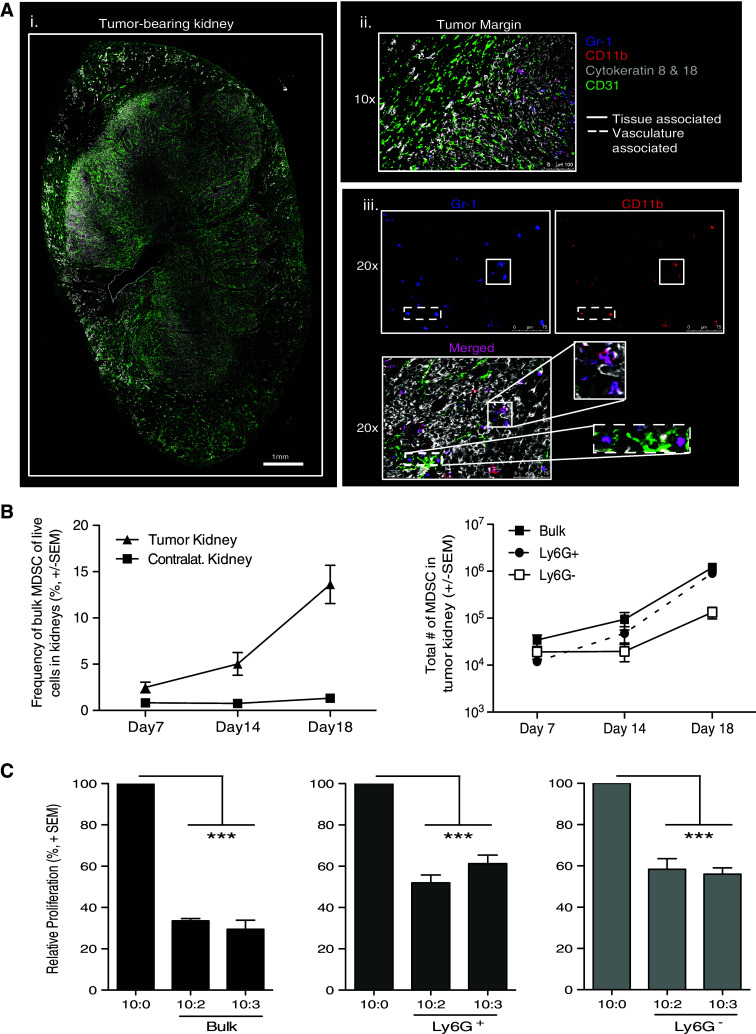
Characterization of MDSC within tumor-bearing kidneys. BALB/c mice were implanted IR with 2 × 10⁵ Renca. a WT tumor-bearing kidneys were harvested on day 12 for IF imaging to identify MDSC. i, ii 10× images were taken and stitched together to view the entire tumor-bearing kidney, and tumor margin architecture with CD31 and cytokeratins 8 and 18. The tumor margin image also includes Gr-1 and CD11b staining to visualize MDSC. iii Separate 20× images were taken to visualize Gr-1 alone, CD11b alone, and merged Gr-1+CD11b+ cells within the tumor using the structural markers to identify the regions of tumor tissue and vasculature within the kidney. Images are representative of four independent experiments totaling 8 mice. b Tumor-bearing and contralateral kidneys were harvested from mice 7, 14, or 18 days post-tumor implantation. Single-cell suspensions were made, and cells were stained for flow cytometric analysis. Mean (±SEM) frequency and number of bulk, Ly6G+, or Ly6G− MDSC in tumor-bearing kidneys during tumor challenge. Data are representative of three independent experiments, with at least 3 mice/group/experiment. c Tumor-bearing kidneys were harvested after 18–21 days. Bulk MDSC were sort-purified to ≥95 % purity. Cocultures were plated and pulsed with [3H] thymidine during the last 18 h of incubation to assess proliferation. Relative mean (±SEM) CD8+ T-cell proliferation was calculated based on normalization to the 10 CD8+ T cells/1 spDC/0 MDSC control group. Data are representative of two independent experiments where samples were each run in triplicate. Cultures containing bulk MDSC were compared to the control group using 2-way ANOVA, ***p ≤ 0.001
