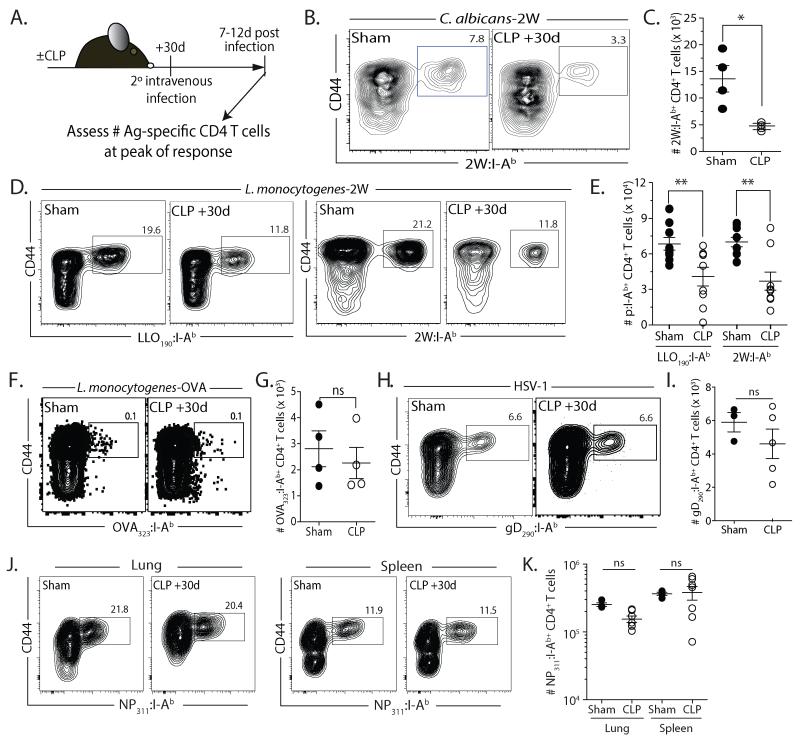
FIGURE 4. Expansion of epitope-specific populations correlates with precursor pool recovery after septic injury.
A. Experimental design. Mice were infected with 2W1S-expressing C. albicans (C. albicans-2W; 5×10⁴ yeasts in 0.1 ml i.v.), attenuated 2W-expressing L. monocytogenes (Lm-2W or Lm-OVA; 107 CFU in 0.1 ml i.v.), HSV-1 (2.5×10⁴ PFU in 0.1 ml i.v.), or influenza A virus (×31; 3000 EID50 in 0.02 ml i.n.) 30 d after sham or CLP surgery. After another 7-12 d, the frequency and number of Ag-specific CD4 T cells was determined in the spleen. B-C. Representative flow plots showing the frequency (B) and number (C) of 2W1S-specific CD4 T cells in the spleens from sham- and CLP-treated mice 7 d after i.v. infection with C. albicans-2W. D-E. Representative flow plots showing the frequency (D) and number (E) of LLO190- and 2W1S-specific CD4 T cells in the spleens from sham- and CLP-treated mice 7 d after i.v. infection with Lm-2W. F-G. Representative flow plots showing the frequency (F) and number (G) of OVA323-specific CD4 T cells in the spleens from sham- and CLP-treated mice 7 d after i.v. infection with Lm-OVA. H-I. Representative flow plots showing the frequency (H) and number (I) of gD290-specific CD4 T cells in the spleens from sham- and CLP-treated mice 9 d after i.v. infection with HSV-1. J-K. Representative flow plots showing the frequency (J) and number (K) of NP311-specific CD4 T cells in the lungs and spleens from sham- and CLP-treated mice 12 d after i.n. infection with ×31. Statistical significance was determined using group-wise, one-way ANOVA analyses followed by multiple-testing correction using the Holm-Sidak method, with α = 0.05. ** p < 0.01; * p < 0.05; and n.s. – not significant. Data shown are the combined results from 2-4 independent experiments per pathogen tested, with 3-5 mice/group in each experiment.

