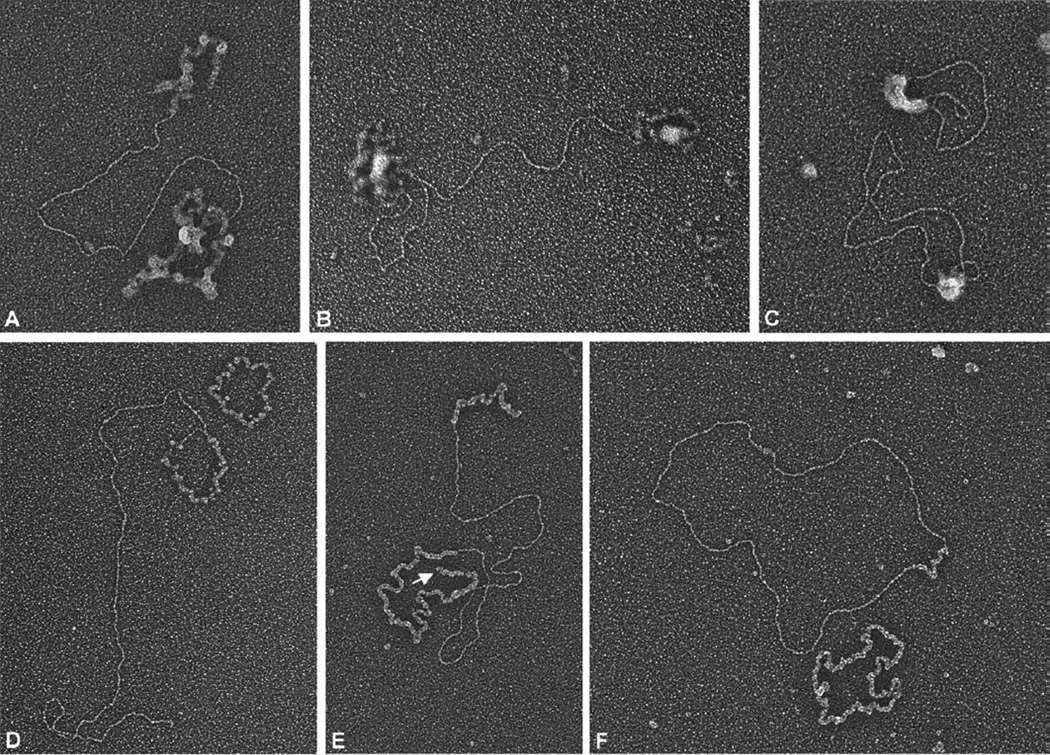
Figure 2.
EM analysis of strand exchange mediated by UL12 and ICP8. Strand exchange reactions were run as described for Figure 1 and further prepared for electron microscopy as described in Materials and Methods. A–C show examples of DNA/ICP8/UL12 complexes formed as a result of strand exchange. Images in D–F were obtained when strand exchange products were deproteinized and the ssDNA complexed with E. coli SSB (see Materials and Methods). The classic strand exchange structures, sigma (A and D), alpha (B and E), and gapped circle (C and F) are shown. The arrow in E points to the displaced strand of the alpha structure. ssDNA circles covered with SSB protein are seen in panels D and F. The scale bar represents the length of 1000 bp of dsDNA.

