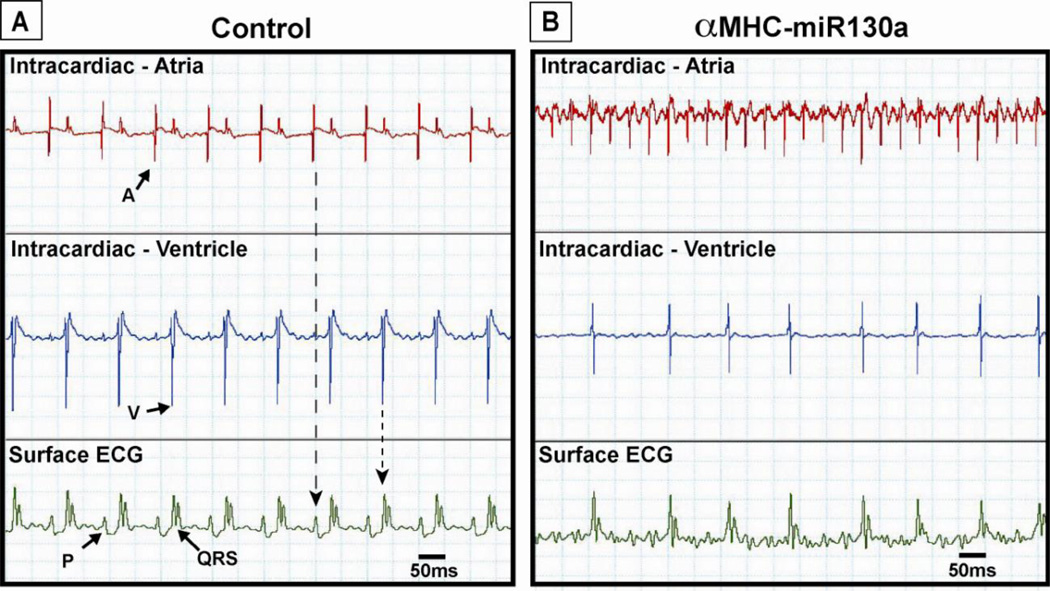
Figure 3. Simultaneous surface and intracardiac electrocardiograms in control and αMHC-miR130a mice.
In (A), simultaneous atrial (top panel), ventricular (middle panel) electrograms and surface ECG (bottom panel) of control mouse demonstrating normal sinus rhythm. Note the presence of regular P waves (P) representing atrial depolarization corresponding to high amplitude signal seen in the atrial recording. High amplitude ventricular signal corresponds to the QRS complex (QRS) on the surface ECG representing ventricular depolarization. In (B), simultaneous atrial, ventricular, and surface ECG in αMHC-miR130a mice. In contrast to the control mouse, the atrial electrogram (B, top panel) shows a rapid irregular atrial signal. The ventricular electrogram (B, middle panel) shows a high amplitude signal corresponding to QRS complexes on the surface ECG with a variable cycle length. Tracings obtained 10–12 weeks off doxycycline. Eight animals were studied in each group. A: atrial signal; V: ventricular signal.

