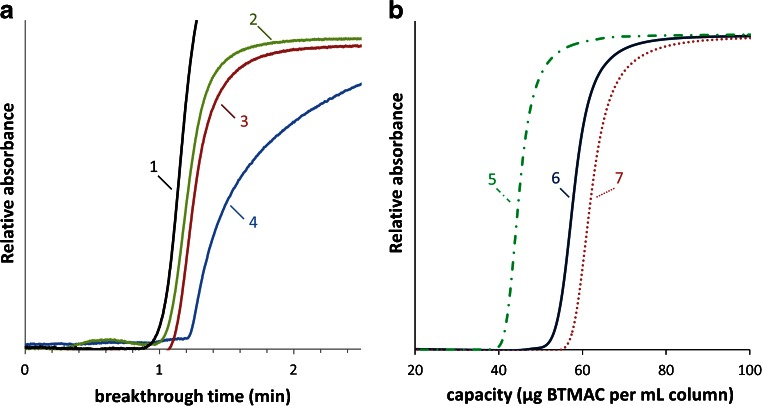
Fig. 3.
Determination of grafting yield through the breakthrough of BTMAC. In A, difference in grafting yield between single-step and two-step approaches in relation to uracil (unretained marker), normalized to 100 mm column length and in B breakthrough curves at varying monomer grafting times (t 2). 1 uracil, 2 single-step 10 min, 3 single-step 20 min, 4–7 two-step with 4 t 1 = 4 min, t 2 = 7 min and c m = 11.3 %, 5 t 1 = 4 min, t 2 = 2 min, c m = 7.5 %, 6 t 1 = 4 min, t 2 = 7 min, c m = 7.5 % and 7 t 1 = 4 min, t 2 = 12 min, c m = 7.5 %

