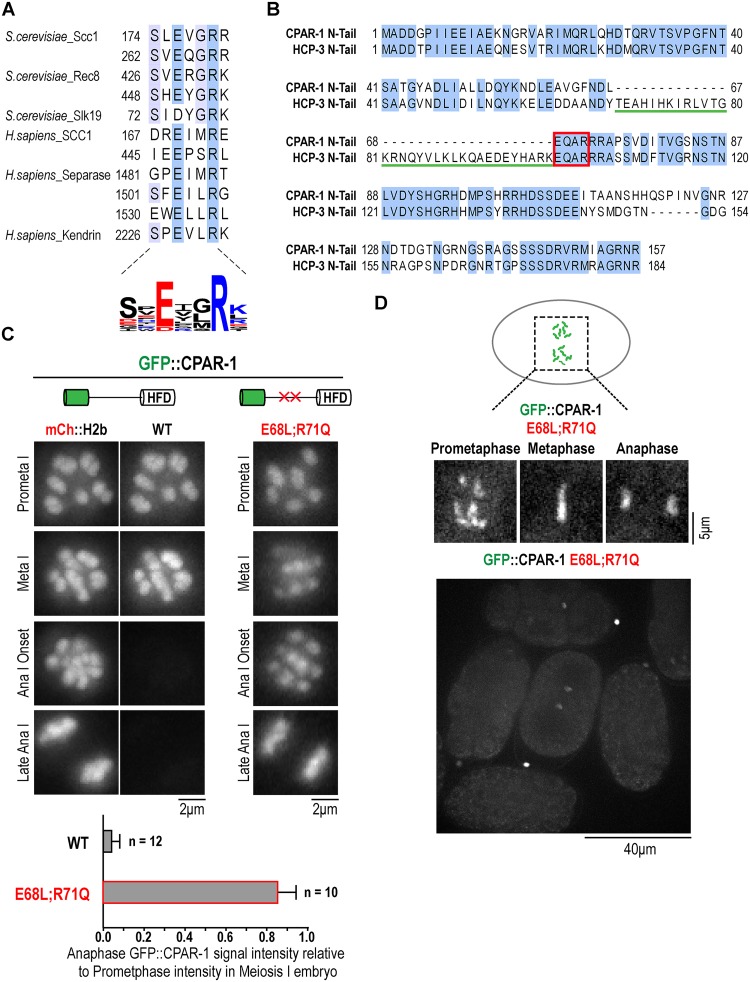
Fig 5. Mutation of a predicted separase cleavage site in the CPAR-1 N-terminal tail prevents loss of GFP::CPAR-1 from chromosome at the meiosis I metaphase-anaphase transition.
(A) Summary of known separase cleavage motifs in the kleisin subunits of the cohesin complex, in the fungal spindle protein Slk19, in vertebrate separase, and in the pericentriolar material protein kendrin. Blue shading indicates conservation of amino acid residues. Sequence alignment performed using Muscle [44] in Jalview 2 [45]. A sequence logo summarizing the distribution of amino acids in the cleavage sites is shown below. Color indicates amino acid charge. Sequence logo was generated with Weblogo (http://weblogo.threeplusone.com/create.cgi) [48,49]. (B) Alignment of the N-terminal tails of HCP-3 and CPAR-1. Both N-tails harbor an EQAR motif that resembles a separase cleavage site. Note the 33 amino acid sequence immediately upstream of this motif in HCP-3 that is absent in CPAR-1. (C) Image frames from time-lapse sequences of meiosis I embryos expressing either GFP::CPAR-1WT (OD416) or GFP::CPAR-1E68L;R71Q (OD180). GFP::CPAR-1 intensities were quantified by taking average projections of 8 μm thick sections (5 slices total) in a 5 μm by 5 μm region of interest encompassing the chromosomes. Background signal intensity was subtracted out of each projected stack and integrated GFP signal was normalized relative to average integrated GFP signal on chromosomes in prometaphase I. For WT GFP::CPAR-1, mCherry::H2b was crossed in and imaged at the same time to highlight the abrupt loss of GFP fluorescence. No loss of GFP fluorescence was observed at meiosis I anaphase onset for the E68L;R71Q mutant form of GFP::CPAR-1. GFP signal loss from chromosomes was quantified on chromosomes 60 seconds post anaphase I onset relative to chromosomes at prometaphase I within the same cell. For GFP::CPAR-1, chromosomal GFP signal dropped 60 seconds after the metaphase-to-anaphase transition to 0.04 +/- 0.05 (n = 12), relative to prometaphase I. In contrast, for GFP::CPAR-1E68L;R71Q, chromosomal GFP signal persisted at 0.85 +/- 0.09 (n = 10), relative to prometaphase I. Scale bars, 2 μm. * p-value < 0.0001. (D) Frames from a time-lapse sequence of a one-cell mitotic embryo expressing GFP::CPAR-1E68L;R71Q (OD180). Similar results were observed in n = 3 embryos. Scale bar, 5 μm. Lower panel shows a field of multi-cellular embryos expressing GFP::CPAR-1E68L;R71Q.

