
Fig 3. Behavioral results.
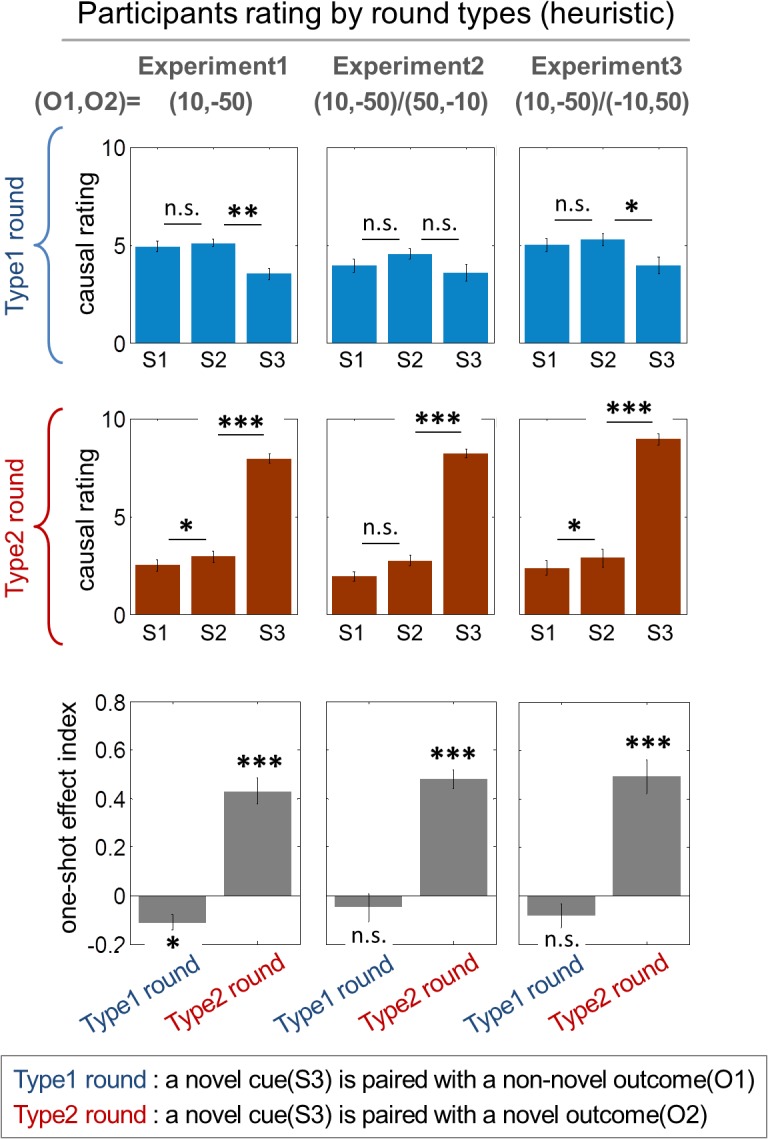
Participants rating patterns classified according to stimulus-outcome novelty pairings (heuristic causal judgment). O1,O2 indicates an outcome condition, where O1 refers to the amount of the non-novel outcome and O2 refers to the amount of the novel outcome. The type1 round and the type2 round refer to rounds in which a novel cue is paired with a non-novel outcome and with a novel outcome, respectively. S1 and S2 refer to the non-novel cues, and S3 refers to a novel cue that is presented only once each round. The first two rows (“causal rating”) show subjects’ causal ratings (scale: 0–10) describing the subjective judgment about the extent to which a given stimulus caused the novel outcome on each trial type as a function of stimulus novelty. Each column refers to the experiment in which different magnitudes of outcomes are used, as indicated by O1,O2. In the first experiment, participants performed a task while being scanned with fMRI. The second and the third experiment were follow-up behavioral experiments (see Materials and Methods; test statistics are provided in the main text). The third row (“one-shot effect index”) illustrates the quantification of the one-shot learning effect in the causal rating dataset. The one-shot effect index is defined as the causal rating for the novel cue minus the average causal ratings for the non-novel cues. The one-shot learning effect indices are significantly positive in the type2 rounds, whereas they are zero or negative in the type1 rounds. *: p < 1e-2, **: p < 1e-3, ***: p < 1e-4; paired-sample t test for underlined asterisks and one-sample t test for asterisks without an underline. Error bars are standard error of the mean (SEM) across subjects.