
Fig 6. Functional correlation between prefrontal cortex and hippocampus activity.
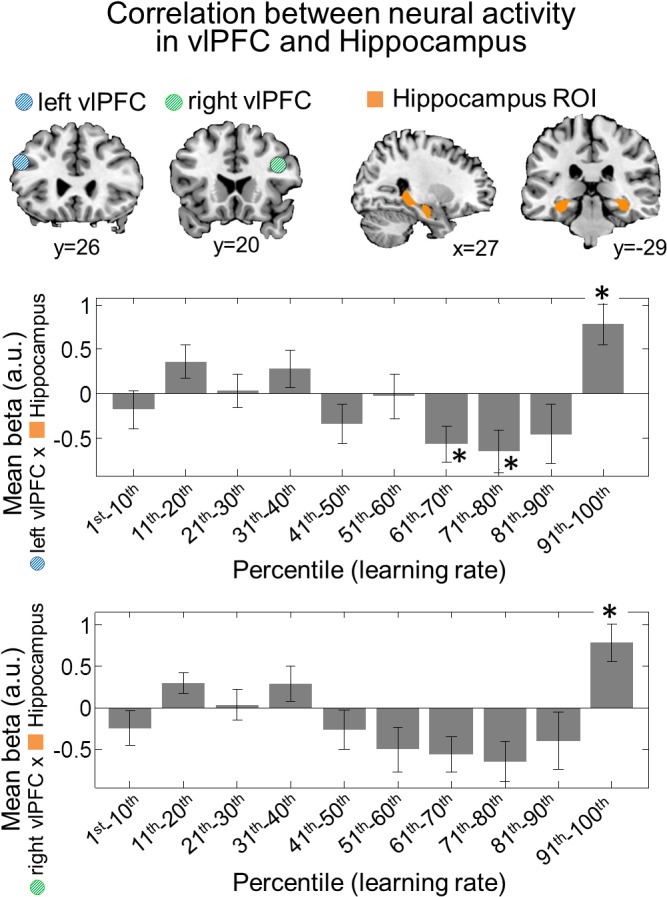
The blue and green circles represent a 5-mm sphere region of the left and the right ventrolateral prefrontal cortex, respectively, the area identified as processing causal uncertainty information, from which the first eigenvariate of BOLD signals were extracted. The left and right hippocampus ROIs were anatomically defined [54]. Shown are the average beta values within the hippocampus ROIs when the BOLD activity of ventrolateral prefrontal cortex was used as a parametric modulator in the fMRI analysis. This enables correlations to be calculated between activity in ventrolateral prefrontal and hippocampus as a function of learning rate. We found significant positive correlations between the two areas during the events in which rapid learning is predicted by the model (91st–100th percentile of learning rate). The asterisks shows the statistical level at which the beta value is significantly different from zero after Bonferroni adjustment for multiple comparisons across the ten learning bins (one-sample t test; *: p < 1e-2). Error bars are SEM.