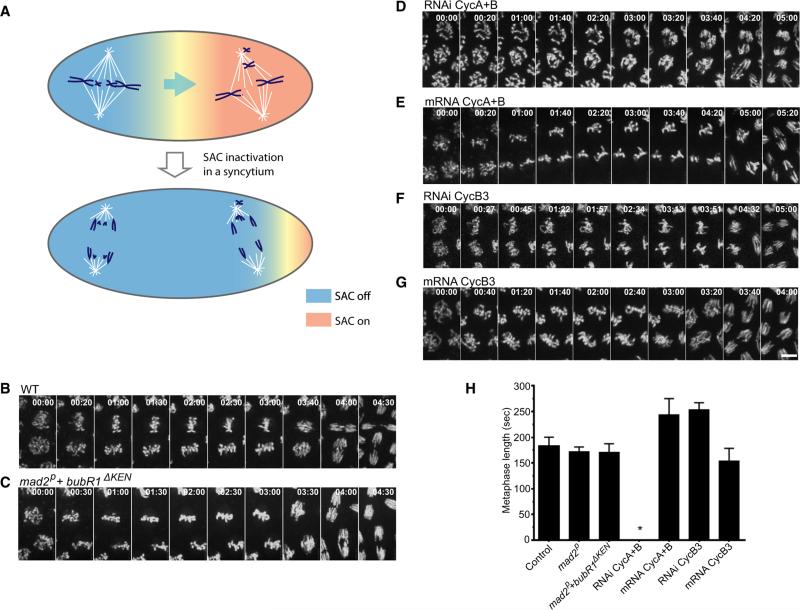
Figure 1. Mitotic Cyclins, but Not the SAC, Dictate Timing of Anaphase Onset.
(A) Schematic showing that checkpoint release by the first aligned spindle hurries the slower prometaphases into anaphase in a syncytium.
(B–G) Mitotic progress was visualized in real time by following H2AvD-GFP produced from a transgene (B, D–G), or from injected mRNA (C). Frames from videos at the indicated times (min:s) show mitosis 13 beginning at prometaphase. The time lapse to the beginning of chromosome separation reveals the timing of metaphase-anaphase in the different genotypes and injected embryos. Scale bar, 5 mμ.
(H) Comparison of metaphase duration. SAC-deficient embryos did not differ significantly from wild-type (unpaired t test, control versus mad2p: p = 0.0752; control versus mad2p+bubR1ΔKEN: p = 0.0929). Changing the levels of particular cyclins had a cyclin-type-specific effect on metaphase duration. No obvious metaphase was seen in Cyclin A- and B-depleted embryos (star), whereas a prolonged metaphase was observed when the level of Cyclin A and B was increased by mRNA injection (unpaired t test, p < 0.0001). Knockdown of Cyclin B3 extended metaphase (unpaired t test, p < 0.0001), and Cyclin B3 mRNA injection slightly shortened metaphase (unpaired t test, p = 0.0124). Error bars represent the SD.

