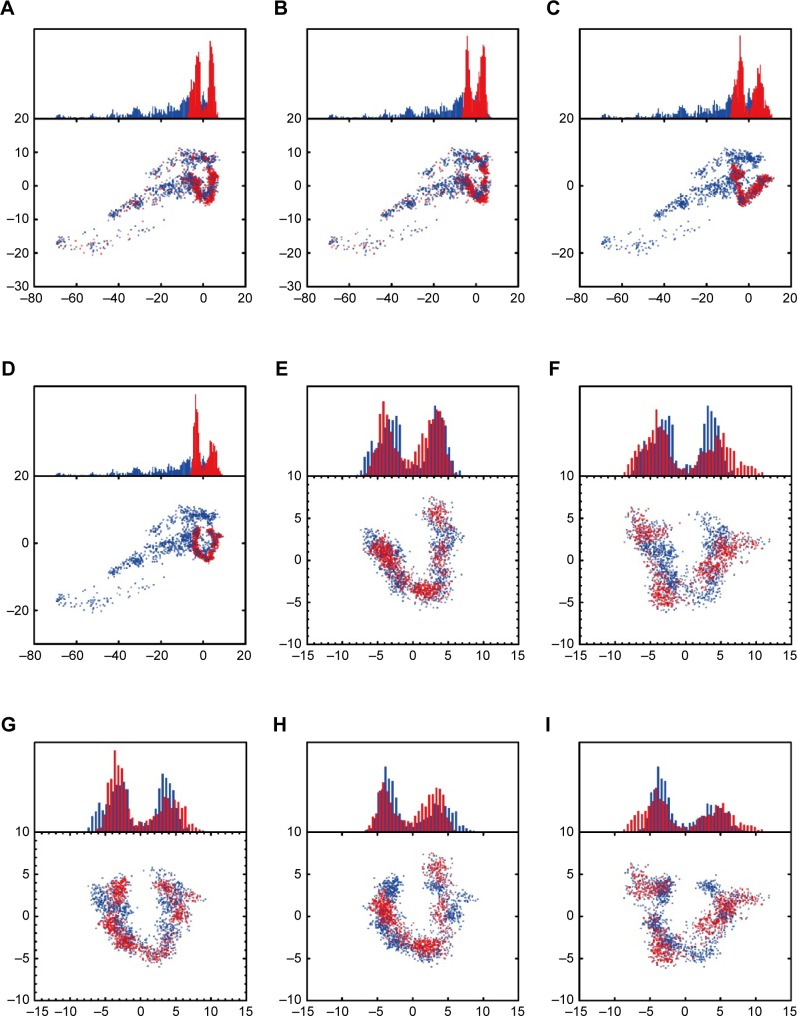
Figure 9.
Principal component analysis.
Notes: Apo (blue color) and (A) mutants-apo (red color), (B) top1 (red color), (C) top2 (red color), (D) the control (red color). Mutants-apo (blue color) and (E) top1 (red color), (F) top2 (red color), (G) the control (red color). The control (blue color) and (H) top1 (red color), (I) top2 (red color).

