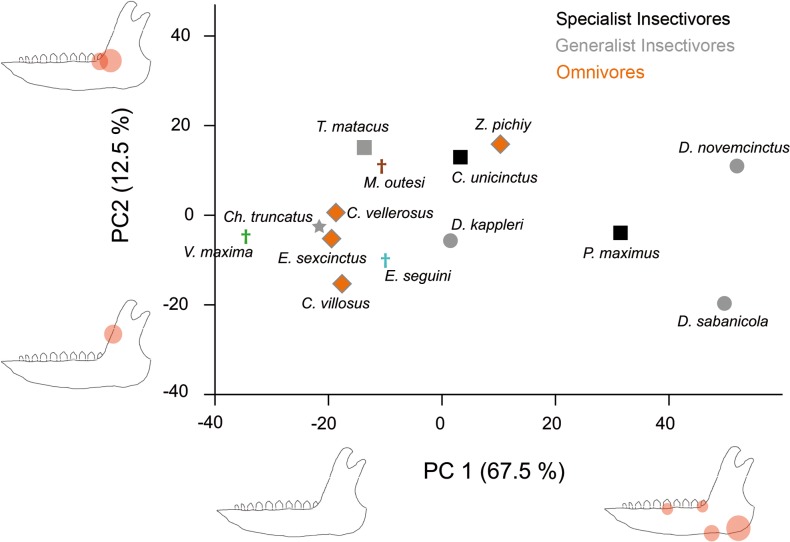
Fig 6. Dispersion graph of the two first principal components for Set 2.
An hypothetical lower jaw is represented in each extreme of the axes, highlighting those landmarks with higher loadings in each PC (i.e., that have more importance in that PC) with red circles. The size of the circles is an approximation to the standardized value of the loading. Subfamilies are represented by different symbols; squares: Tolypeutinae, circles: Dasypodinae, diamonds: Euphractinae, stars: Chlamyphorinae.

