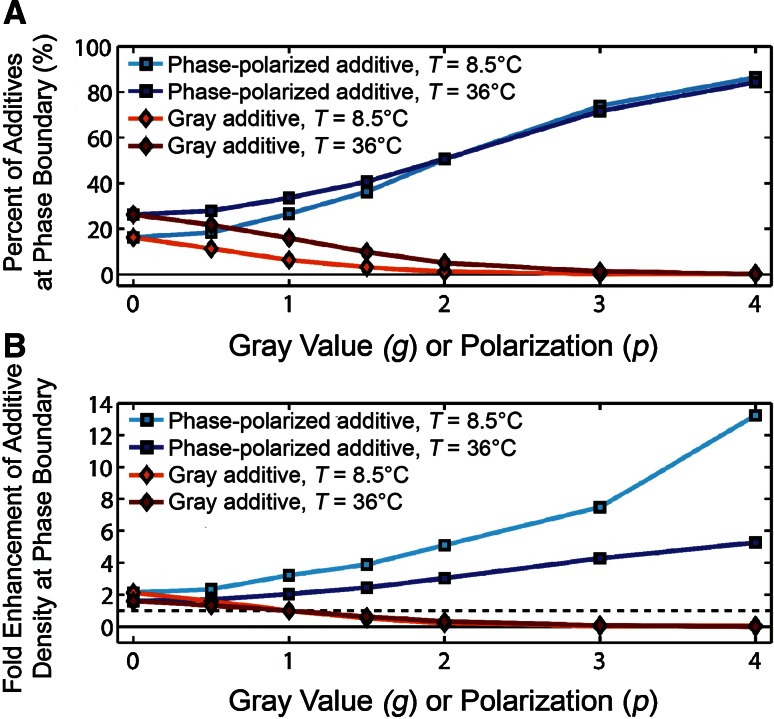
Fig. 4.
a The probability that an additive was found at the phase boundary varied with the additive properties and temperature. The fraction of additives at the boundary was calculated as the ratio of the number of additives surrounded by two white and two black particles versus the total number of additives, excluding additives adjacent to other additives. b The additive locations were normalized by the amount of phase boundary in each condition to yield the fold enhancement of the additive at the phase boundary versus generic white particles. Additives were present at 1 mol%. Uncertainty was calculated as the standard deviation of different time points and smaller than the symbol unless otherwise indicated

