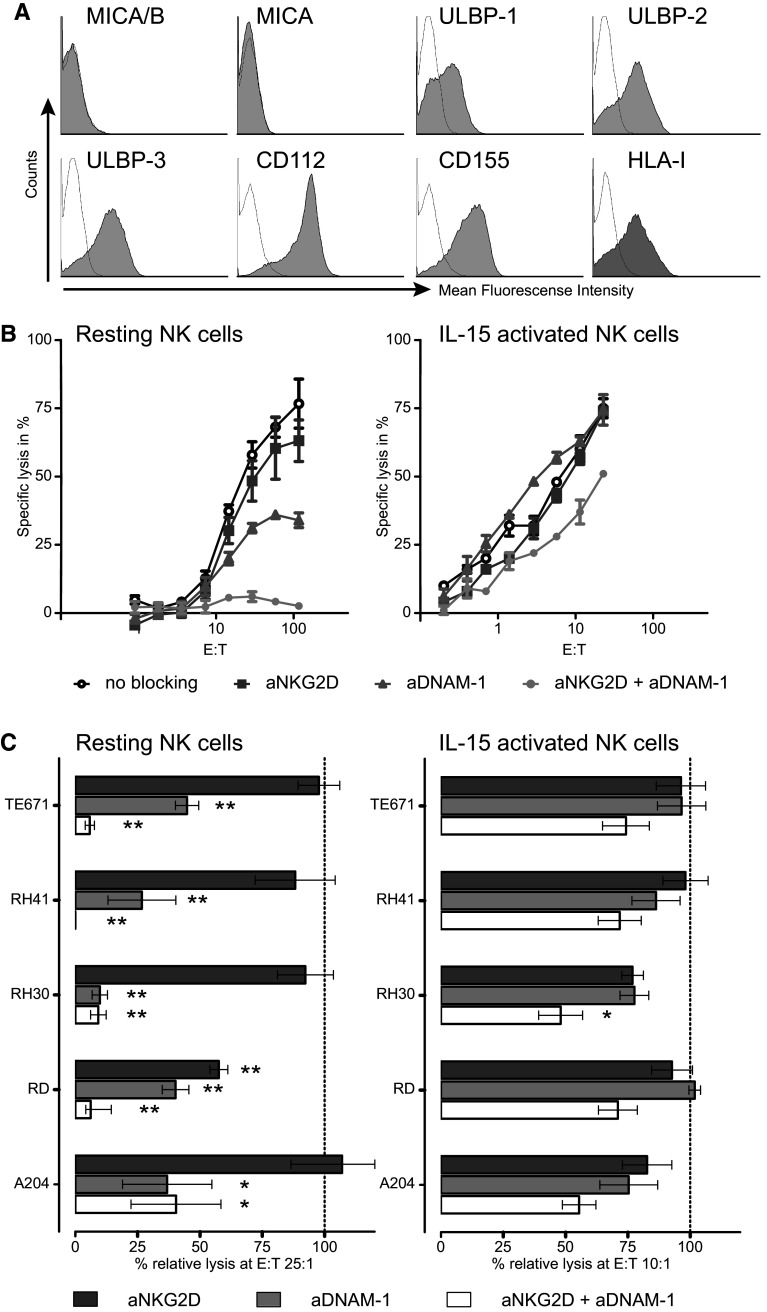
Fig. 3.
Lysis of RMS cell lines by resting NK cells is dependent on NKG2D and DNAM-1-mediated pathways. a Histograms of expression levels (gray area isotype control thin line) of NKG2D (MIC A/AB, ULBP1-3), DNAM-1 ligands (CD112 and CD155) and HLA-1 for the cell line TE671 measured by flow cytometry. b Representative specific lysis of the cell line TE671 by resting (left panel) and IL-15-activated NK cells (right panel) in the presence or absence (open circle) of blocking antibodies to NKG2D (square), DNAM-1 (triangle) or the combination of these two receptors (closed circle). Error bars represent the SEM of triplicates. c Combined data for the lysis of the RMS cell lines by resting (5 donors, E:T ratio 25:1, left panel) and IL-15-activated (6 donors, E:T ratio 10:1, right panel) NK cells in the presence of blocking antibodies to NKG2D (dark gray bars), DNAM-1 (light gray bars) and the combined antibodies (white bars). Data are depicted as percentage of the specific lysis obtained in the absence of blocking antibody. Error bars represent the SEM. Statistical analyses were performed using one-way ANOVA, followed by the Dunnett’s multiple comparisons test: p value <0.05 is indicated by *; <0.01 by **)

