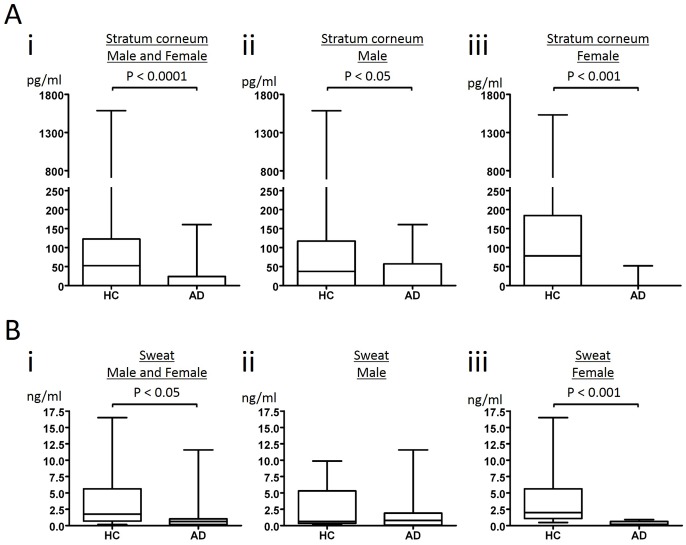
Fig 1. GCDFP15 levels in stratum corneum and sweat.
Stratum corneum (SC) extracts (A) and sweat samples (B) were obtained from healthy control (HC) and atopic dermatitis (AD) individuals (i; male and female, ii; male, iii; female). GCDFP15 in SC extracts and sweat was quantified by ELISA. The results are expressed in box plot. The rectangle spans the first quartile to the third quartile. A segment inside the rectangle shows the median, and whiskers above and below the box show the locations of the minimum and maximum.

