Fig. 5.
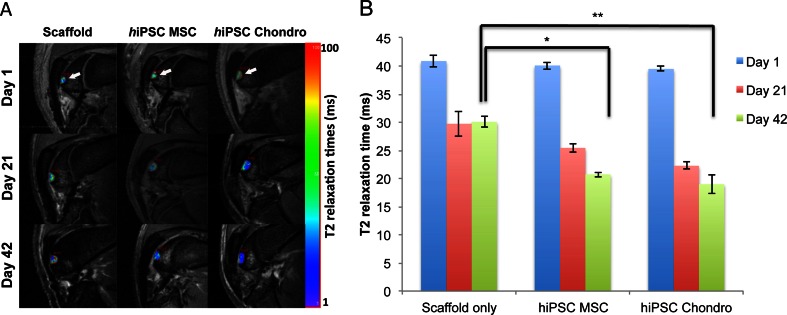
In vivo engraftment of hiPSC-derived MSCs and Chondrogenic Cells. (a) Sagittal T2-weighted MR images of implants of scaffold only, hiPSC-derived MSCs, and hiPSC-derived chondrogenic cells in osteochondral defects of the distal femurs of rat knee joints. Superimposed T2 relaxation time maps show decreasing T2 values of transplanted cells, but not scaffold only, over time. (b) Corresponding quantitative measures of T2-relaxation times of cell transplants and scaffold only. Data are displayed as means and SE of triplicate experiments. (* and ** indicates p < 0.05 and p < 0.01 respectively)

