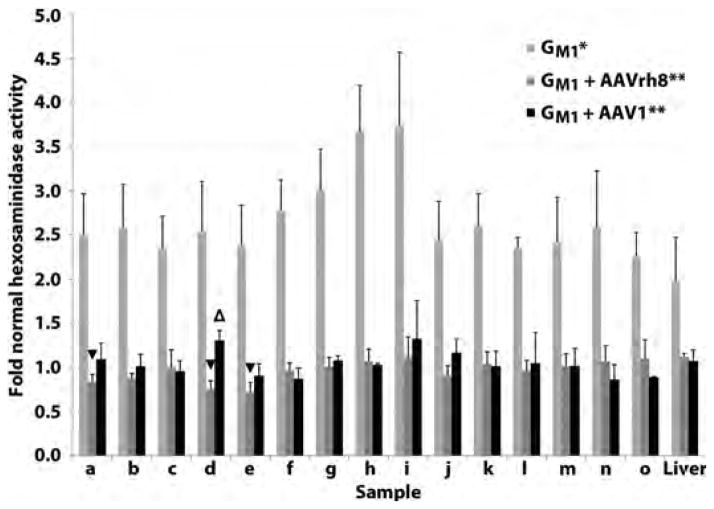
Fig. 3. Normalization of lysosomal hexosaminidase activity in the CNS and liver of GM1 cats 16 weeks post-treatment.
GM1 cats were injected bilaterally in the thalamus and deep cerebellar nuclei with 3–4 × 10¹² vg of AAVrh8 (n = 4, dark gray bars) or AAV1 (n = 3, black bars). Tissues were collected 16 weeks post-treatment and hexosaminidase activity compared to untreated GM1 cats (n = 4, light gray bars) and normal healthy cats (n = 4) in the brain (a–h), spinal cord (i–o), and liver. Lettering of brain and spinal cord blocks corresponds to Fig. 1A. *, all samples from untreated GM1 cats were significantly higher than normal (P ≤ 0.015 for each sample); **, all samples from treated GM1 cats were significantly lower than untreated GM1 cats (P ≤ 0.026 for each sample); △, indicates a sample from treated cats that was significantly higher than normal (P = 0.026); ▼, indicates samples from treated cats that were significantly lower than normal (P ≤ 0.030). The Wilcoxon signed rank test was used for statistical comparisons.

