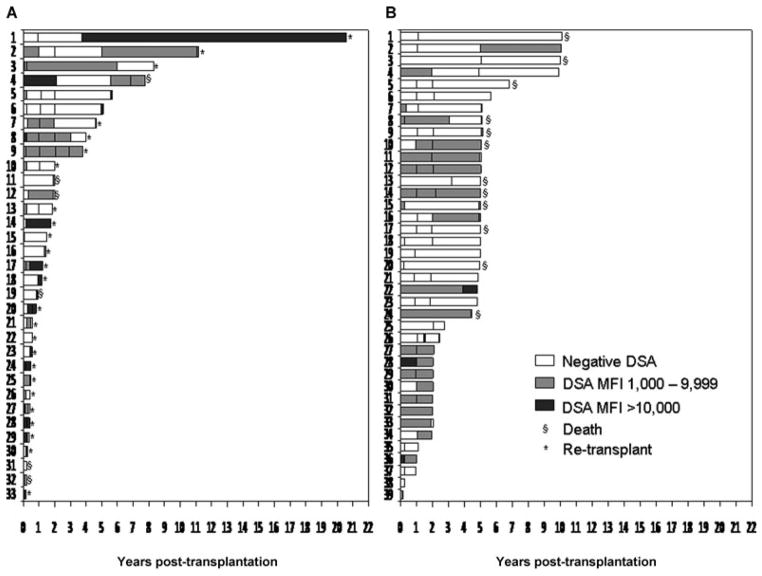
Figure 1.
Antibody profile of the (A) chronic rejection group and (B) comparator group. Each patient is represented by a bar and the DSA status is represented by different colors. (Six patients in the chronic rejection group are not depicted because only one sample was available for analysis.) All patients in the comparator group who died, dies >5 years after transplant with a normally functioning graft.

