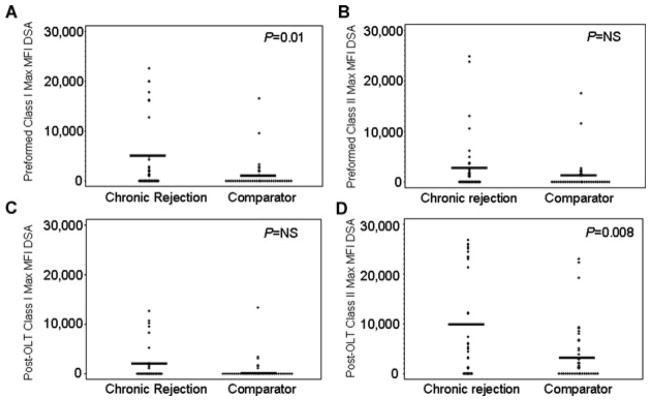
Figure 2.
Highest mean fluorescent intensity (MFI) donor-specific antibody (DSA) for (A) preformed class I (mean MFI 4075 vs. 1027), (B) preformed class II (mean MFI 2849 vs. 1209), (C) post-OLT class I (mean MFI 1858 vs. 600) and (D) post-OLT class II (mean MFI 9930 vs. 3637). + represents each patient’s maximum value, line represents the group’s mean value.

