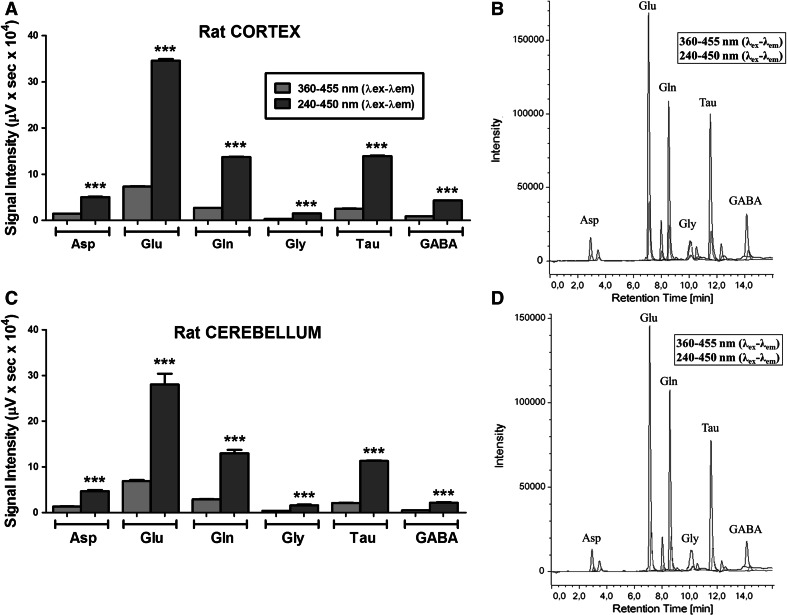
Fig. 4.
Analysis of neuroactive amino acids. Comparison of excitation–emission (λ ex–λ em) protocols. Statistical comparison of the 360- to 455- and 240- to 450-nm proposed protocol using samples of rat cortex (a) and cerebellum (c). b, d Representative chromatograms of rat cortex and cerebellum samples, respectively. Data are expressed as the mean ± SEM of four independent samples. Statistical analysis was performed using the Student’s t test. ***P < 0.001 versus 365λex–455λem

