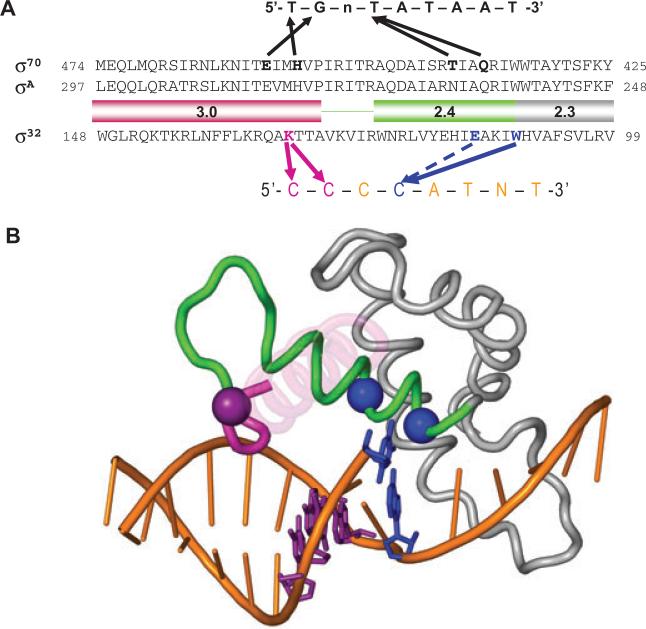
Fig. 9.
Structural model of the recognition of the −10 region of promoter by σ32.
A. Comparison of the recognition of the −10 region of promoters by σ70 and σ32. Amino acid sequences of Regions 2.3, 2.4 and 3.0 of σ70, σA and σ32 are shown. The −10 consensus promoter sequences for each σ is indicated above or below the amino acid sequences. Thick arrows indicate contacts suggested by the previous studies for σ70 and in this study for σ32. Arrow with dotted line indicates contact to increase selectivity.
B. Shown is the structure of σA Regions 2.1–3.0 and the −10 element region of the fork-junction promoter DNA from the T. aquaticus holoenzyme/fork-junction promoter DNA complex (Murakami et al., 2002). The rest of the protein and DNA are not shown. The σA Region 2.4 is coloured green and Region 3.0 is magenta. Most of the 3.0 helix is transparent for clarity. The positions corresponding to residues of σ32 that make base-specific contacts with the promoter are shown as α-carbon spheres, and colour-coded along with the corresponding DNA base pair: W108 (W257 in T. aquaticus σA)/−11CG, blue; E112 (A261)/−11CG, blue; and K130 (M279)/−13CG/−14CG, purple. This figure was prepared using PyMol (http://pymol.sourceforge.net/).

