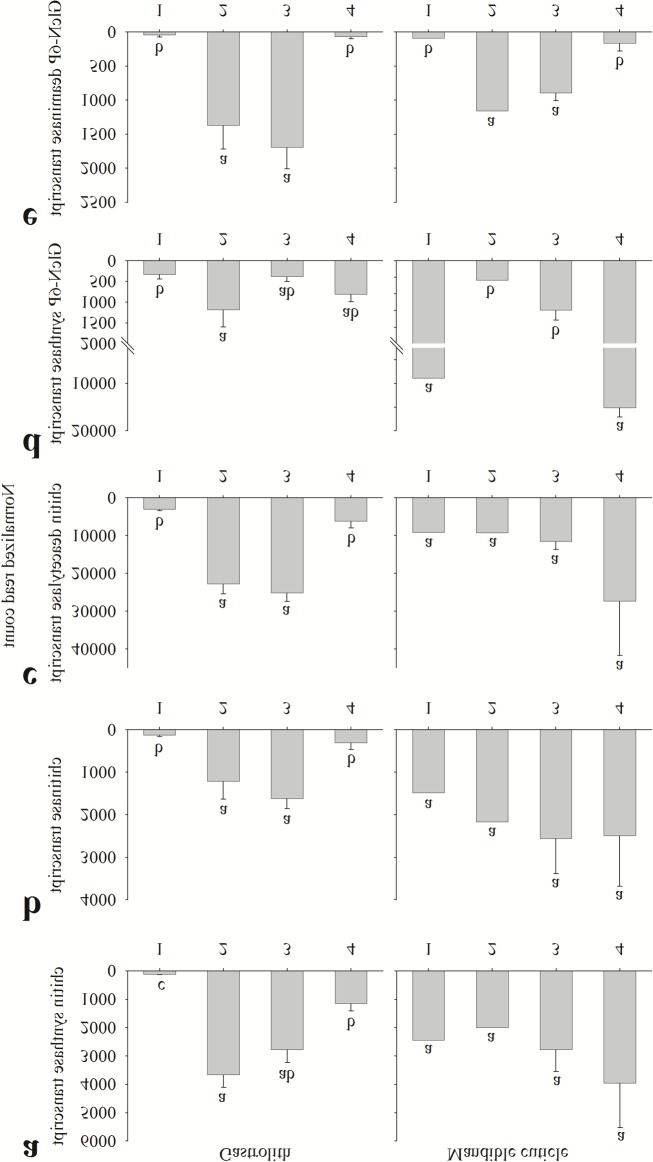
Fig 5. Normalized read count of key chitin metabolism-related genes transcripts.
Read count of key chitin metabolism-related genes transcripts from the gastrolith-forming epithelium (left) and the mandible cuticle-forming epithelium (right). Numbers on the X axis represent the four molt stages, 1 inter-molt (pool of animals, n = 1), 2 early pre-molt (pool of animals, n = 1), 3 late pre-molt (two single animals and one pool, n = 3) and 4 post-molt (all single animals, n = 2). Presented transcripts are (a) chitin synthase, (b) chitinase, (c) chitin deacetylase, (d) GlcN-6P synthase and (e) GlcN-6P deaminase. Letters represent statistical groups which are significantly different (p-value <0.05), error bars represent standard error.

