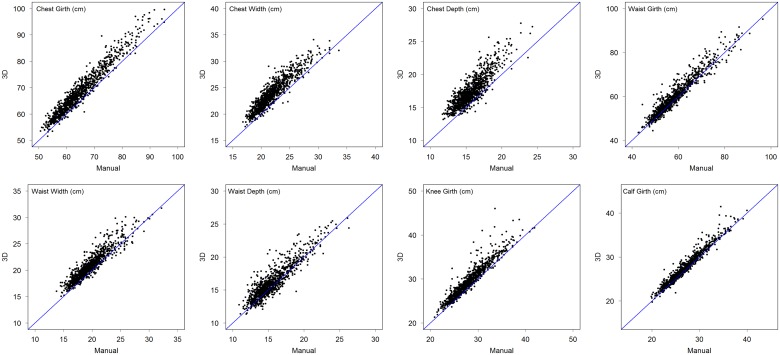
Fig 6. Plots of 3D-PS values (y-axis) against manual values (x-axis) for each of the eight outcomes, superimposed on the line of identity.
The plots illustrate a general tendency for 3D-PS values to exceed manual values, with this over-estimation varying between outcomes. The magnitude of 3D-PS bias is described in detail in Table 5 and supporting information file S1 Table.

