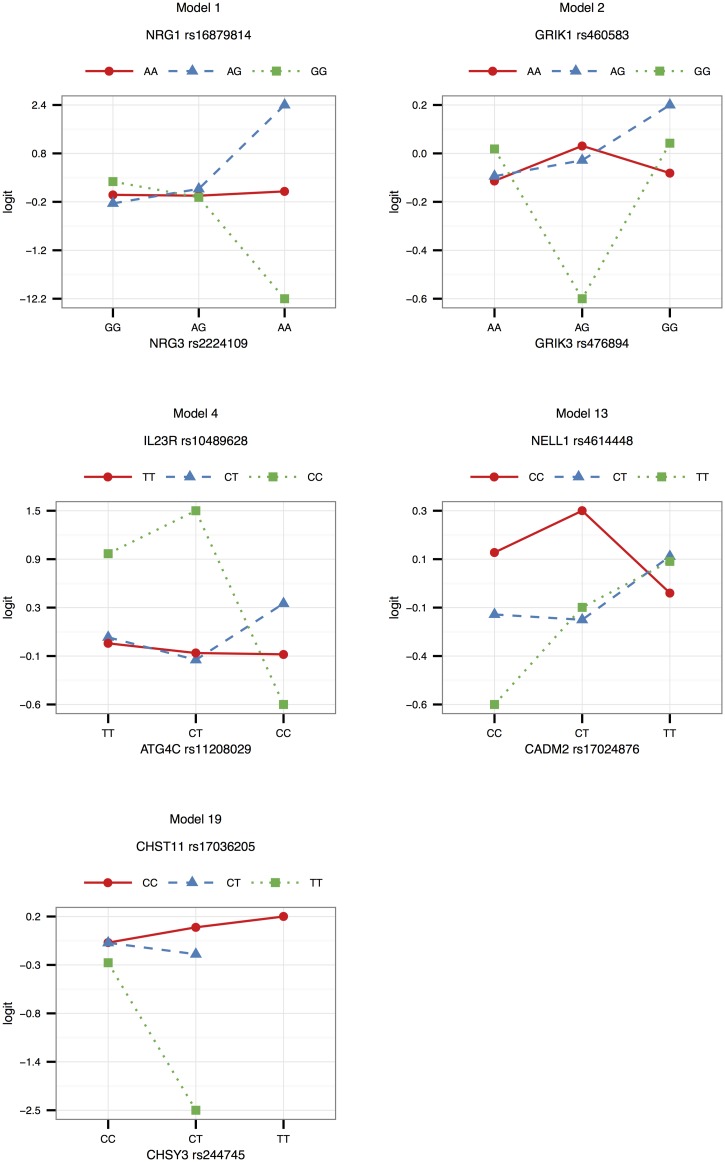
Fig 6. Effects in the Gambian study group.
The logits of genotype combinations from models 1, 2, 4, 13 and 19 are depicted in this figure. Genotypes are ordered according to minor allele frequency, with the wildtype homozygote appearing first, and the rare homozygote appearing last. Non-parallel lines are indicative of interaction effects. The effects were estimated by absorbing the marginal effects of the SNPs into the SNP × SNP interaction term, and adjusting for the covariates included in the model by averaging over them.

