
Figure 4.
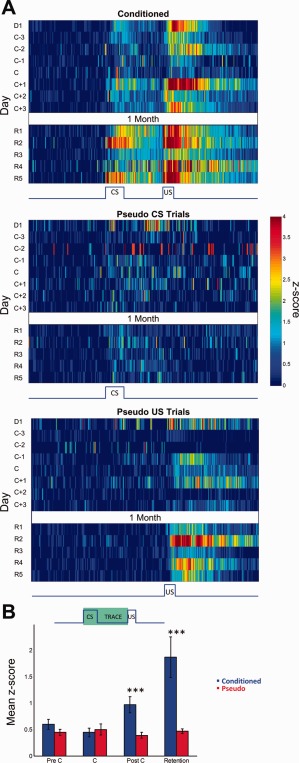
Activity of rate increasing neurons. (A) Mean z‐score peristimulus time histograms encompassing 1 s before and 2 s after CS onset (x‐axis) expressed in pseudo‐color for trials with paired CS‐US presentations from conditioned animals (top) and CS‐only (middle) and US‐only (bottom) trials of pseudo‐conditioned animals over training days (y‐axis). The activity of the US‐only trials from pseudo‐conditioned animals are from the same cells that were responsive during the CS‐only trials. D1: Day 1, C: Criterion, R: Retention. (B) Average CS‐Trace interval z‐scores (y axis) for conditioned and pseudo‐conditioned subjects across learning stages (x axis). Error bars represent SEM preserving the variability among neurons. Two‐way ANOVA indicated a significant group × session interaction in mean CS‐Trace z‐score activity (Interaction: F 3,223 = 4.04, P = 0.008). Activity were significantly different among the groups on PostC and Retention sessions (Bonferroni corrected post hoc two‐tailed unpaired t‐tests, *** P < 0.001).