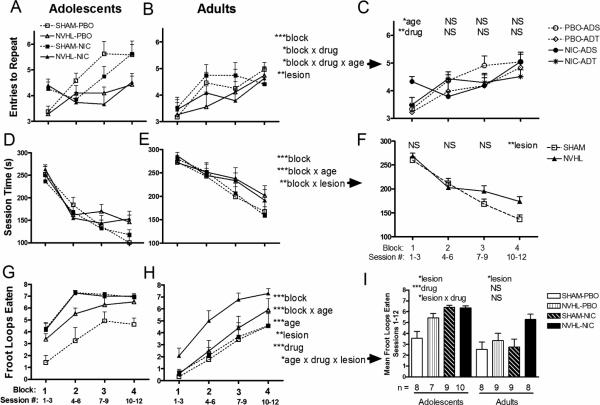
Figure 2. Cognitive testing.
ETR (A, B) Session time (D, E) and Froot loops Eaten (G, H) were analyzed separately using mixed ANOVAs (lesion, drug patch history, age, blocks) with age sorted into columns for visual clarity only. Statistical effects are presented at right of the (B) column (*p<0.05, **p<0.01, ***p<0.001, NS=non-significant), with post-hoc graphs and ANOVAs and exploring specific interactions (indicated by rightward arrows) shown in (C) column. In (C), age and drug history effects were examined at each block; in (F), lesion at each block; in (I), mean Froot Loops consumed over all blocks, were examined as effects of lesion and drug history for each age group. Subgroup numbers (n) shown below (I) are accurate to all panels.

