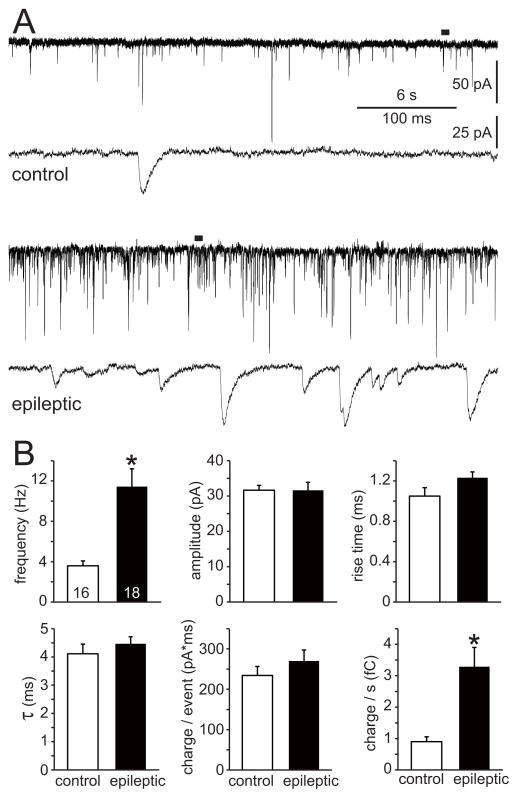
Figure 5.
Excitatory synaptic input to mossy cells was increased in epileptic mice. A Representative miniature EPSC recordings of mossy cells from a control (top) and epileptic (bottom) mouse. Expanded views indicated by bars. B Frequency, amplitude, rise time (10–90%), decay time (τ), charge transfer per event, and charge transfer per second of mEPSCs. Values represent mean ± s.e.m. Number of cells per group indicated at base of bars. Frequency and charge transfer per second were increased in epileptic mice (*p<0.001, Mann-Whitney rank sum test). There were no significant differences in other parameters.

