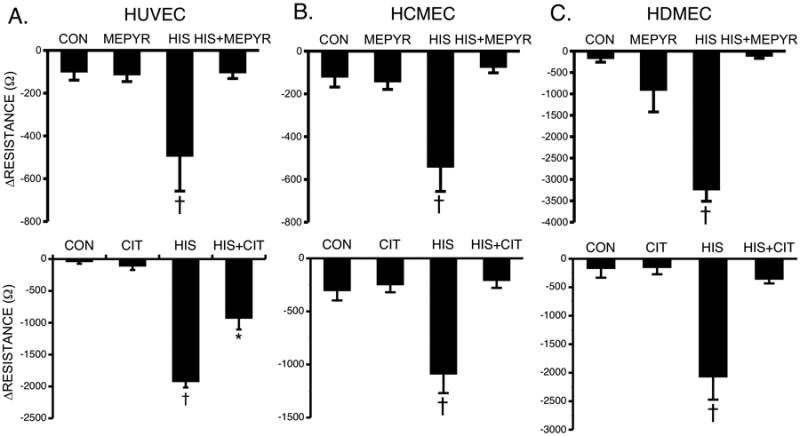
Fig. 4. Blockade of H1 and Histamine-Induced Changes in TER.

(A) Mean maximal changes in TER of HUVEC pretreated with 10 μM mepyramine (top, n=12 for all groups) or 100 nM cetirizine (bottom, n=8 for all groups) for 30 minutes prior to stimulation with 10 μM histamine for 10 minutes (B) Mean maximal changes in TER of HCMEC pretreated with 10 μM mepyramine (top, n=14 for all groups) or 100 nM cetirizine (bottom, n=7 for all groups) for 30 minutes prior to stimulation with 10 μM histamine for 10 minutes. (C) Mean maximal changes in TER of HDMEC pretreated with 10 μM mepyramine (top, n=8) or 100 nM cetirizine (bottom, n=4) for 30 minutes prior to stimulation with 10 μM histamine for 10 minutes. *P<0.01 versus control group. †P<0.01 versus all other groups.
