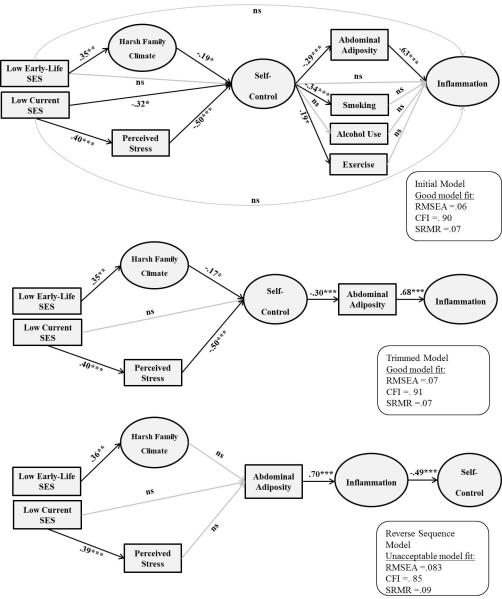
Figure 1.
Structural Equation Models tested. Significant standardized paths are displayed in black, non-significant in gray. Latent variables are represented by circles and observed variables by rectangles. Indicators for each latent factor and paths from age, gender, and ethnicity to the endogenous variables in the structural models were included, but not shown here for visual clarity. ***p < .001; **p < .01; *p < .05; ns = non-significant.

