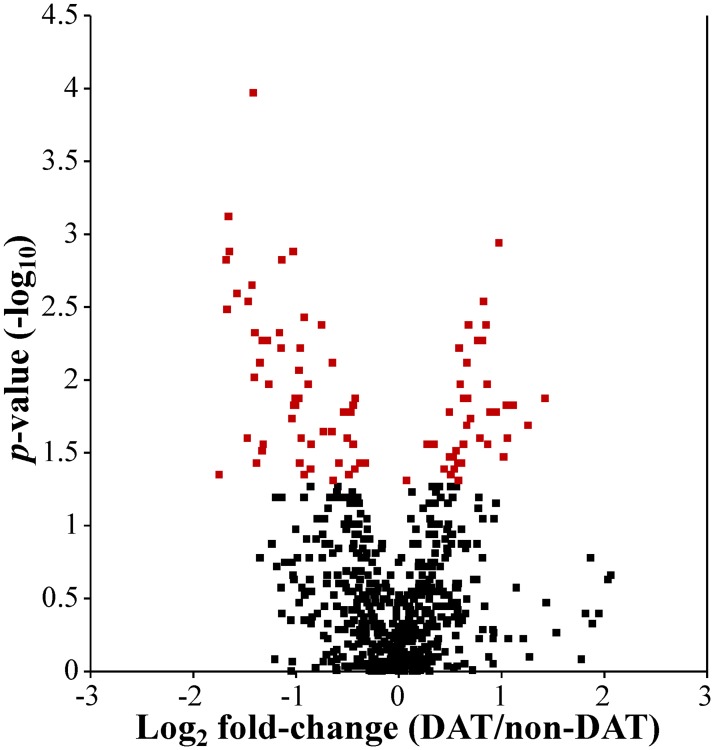
Fig 1. Volcano plot of all 618 spots in the training set.
Spot intensities were compared between chronic DAT and non-DAT samples using a Wilcoxon rank sum test and the-log10 p-value and log2 fold-change (DAT/non-DAT) values were used to generate a volcano plot. Red squares indicate spots with a p<0.05 (n = 93).

