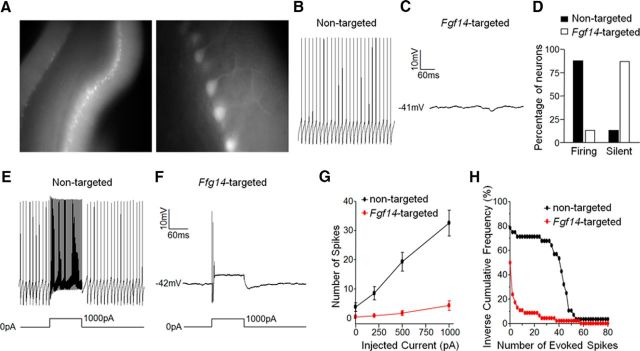
Figure 3.
Spontaneous and evoked firing is attenuated in Purkinje neurons transduced with the Fgf14-targeted shRNA. A, Representative fluorescence images of acute cerebellar slices prepared from a wild-type mouse injected with tdTomato-shRNA AAV1. Low-magnification image (left) shows widespread infectivity of an entire lobule of the cerebellum and the high-magnification image (right) reveals infected Purkinje neurons. B, C, Representative recordings of spontaneous activity in a nontargeted shRNA-transduced Purkinje neuron (B) and a quiescent Fgf14-targeted shRNA-transduced Purkinje neuron (C). D, Percentages of nontargeted (n = 30) and Fgf14-targeted (n = 46) shRNA-transduced Purkinje neurons that fired spontaneously or were silent. The vast majority (>85%) of the nontargeted shRNA-transduced cells were spontaneously active, whereas most (>85%) of the Fgf14-targeted shRNA-transduced Purkinje neurons were silent. E, F, Representative recordings from nontargeted (E) and Fgf14-targeted (F) shRNA-transduced Purkinje neurons before and during a prolonged (250 ms) 1000 pA depolarizing current injection. G, Mean ± SEM numbers of action potentials evoked in nontargeted (n = 28) and Fgf14-targeted (n = 46) shRNA transduced Purkinje neurons are plotted as a function of the amplitude of the injected current. H, Inverse cumulative frequency plots of spike numbers (elicited by 250 ms 1000 pA depolarizing current injections) in nontargeted (n = 28) and Fgf14-targeted (n = 46) shRNA-transduced Purkinje neurons. The frequency distribution in Fgf14-targeted shRNA-transduced neurons is shifted significantly (p < 0.0001, Kolmogorov–Smirnov test) to the left compared with nontargeted shRNA-transduced cells.

