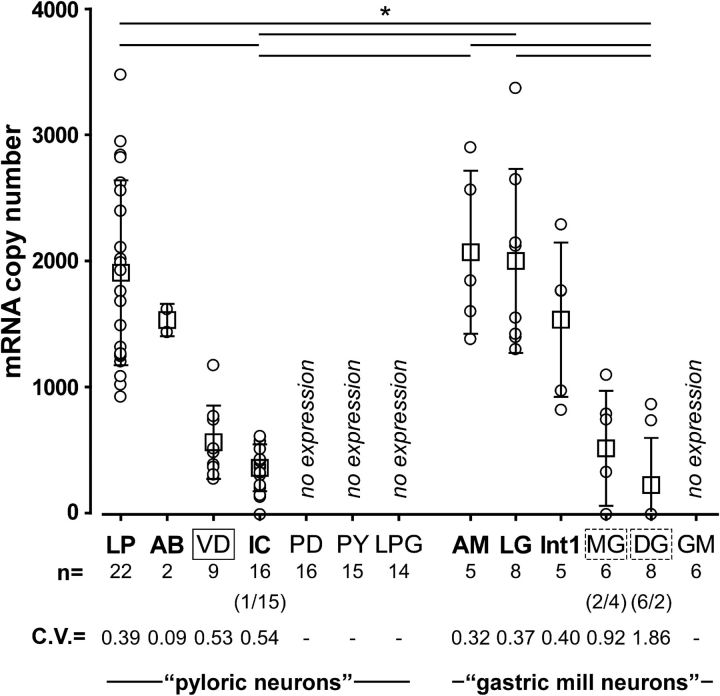
Figure 4.
Single-cell qRT-PCR shows that CbCCAPr is expressed in a subset of STG neurons and at varying levels between cell types. For each cell type, mRNA copy numbers are plotted both for individual measurements (circles) and for means (squares). Cell types included all pyloric and gastric mill neurons (LP; AB; VD; IC; PY, pyloric constrictor neuron; LPG, lateral posterior gastric neuron; AM; Int1, interneuron 1; DG; GM). Cell types previously found to display physiological responses to CCAP are shown in bold. Solid line box around VD represents a mismatch between expression and physiological responsiveness. Dashed boxes around MG and DG represent ambiguity in expression and responsiveness. The number of individual cells measured for each cell type is given in the line beneath the cell type names. For IC, MG, and DG, the numbers in parentheses indicate the number of cells showing no expression/number of cells showing expression. The coefficients of variance are given to indicate variability of expression levels. Mean expression levels were cell type-dependent (one-way ANOVA on ranks, p < 0.001). Pairwise comparisons (Dunn's method) revealed differences as indicated by solid lines on top of the plot (p < 0.05 for each pair). *p < 0.05.

